
Product life cycle and the BCG matrix
Printable study notes to use alongside Part E.2.

Read the handout text
Accounting Ahead | Original study resource | accountingahead.com.au
Product life cycle and the BCG matrix
MODULE 1 | PART E.2 | STUDENT COMPANION
Organisations hold a portfolio of products to spread risk, just as investors hold a portfolio of shares. Product
risks include uncertain demand, volumes, prices, investment needs, competitors and substitutes, and
obsolescence.
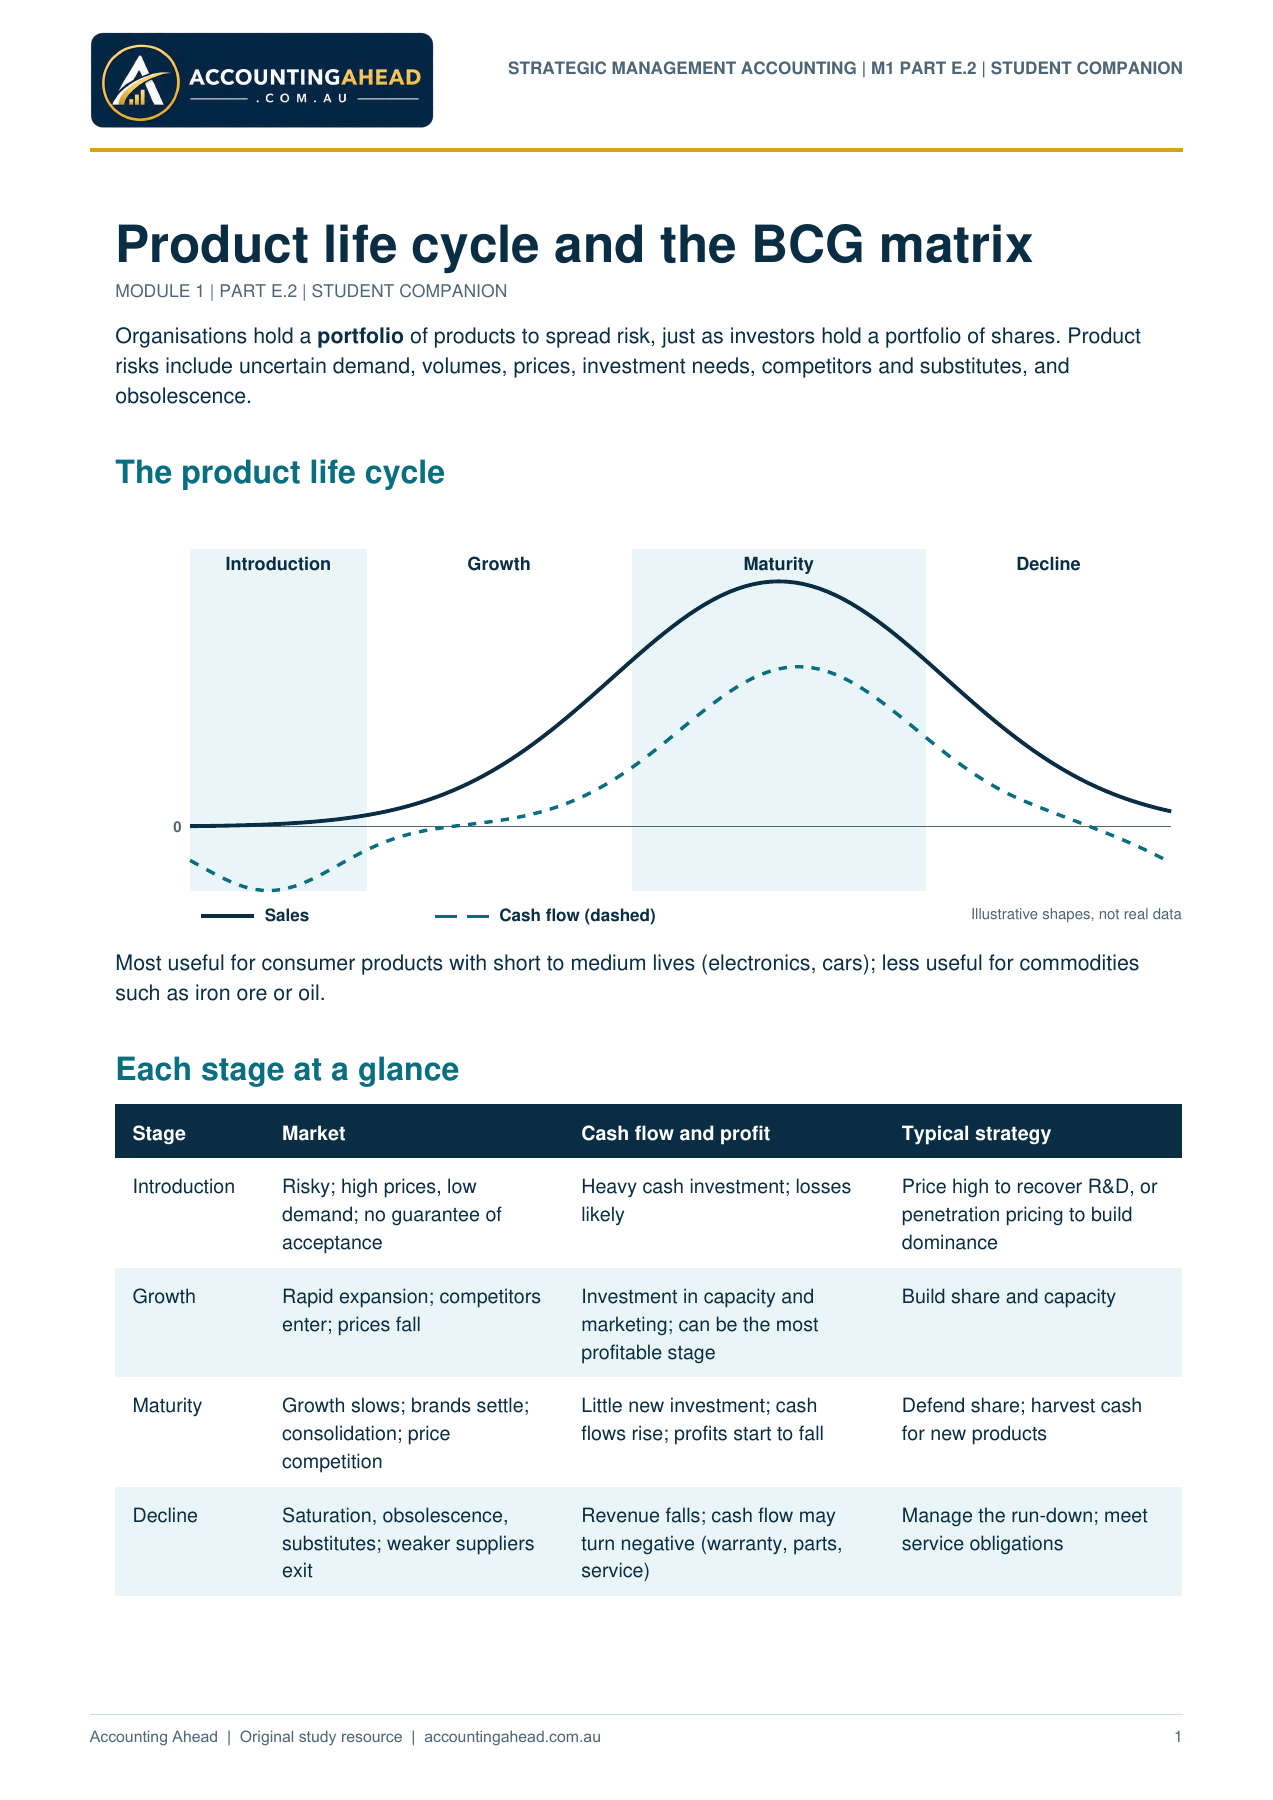
The product life cycle
Introduction Growth Maturity Decline
0
Sales Cash flow (dashed) Illustrative shapes, not real data
Most useful for consumer products with short to medium lives (electronics, cars); less useful for commodities
such as iron ore or oil.
Each stage at a glance
Stage Market Cash flow and profit Typical strategy
Introduction Risky; high prices, low
demand; no guarantee of
acceptance
Heavy cash investment; losses
likely
Price high to recover R&D, or
penetration pricing to build
dominance
Growth Rapid expansion; competitors
enter; prices fall
Investment in capacity and
marketing; can be the most
profitable stage
Build share and capacity
Maturity Growth slows; brands settle;
consolidation; price
competition
Little new investment; cash
flows rise; profits start to fall
Defend share; harvest cash
for new products
Decline Saturation, obsolescence,
substitutes; weaker suppliers
exit
Revenue falls; cash flow may
turn negative (warranty, parts,
service)
Manage the run-down; meet
service obligations
STRATEGIC MANAGEMENT ACCOUNTING | M1 PART E.2 | STUDENT COMPANION
1
Accounting Ahead | Original study resource | accountingahead.com.au
Case note: Nintendo Wii
Nintendo's Wii went on sale at the end of 2006 and was hard to find in shops for months because demand
outran production. It sold more than 100 million units over its life. As the market saturated, sales slowed; its
successor, the Wii U, launched in late 2012, and Wii production in Japan ended in 2013. Nintendo had the next
product ready as the old one declined: portfolio thinking in action.
Sources: Engadget and Fortune/CNN reporting on Wii shortages, 2007; lifetime sales as reported from Nintendo results (about 101.6
million units); Wii U launch, November 2012.
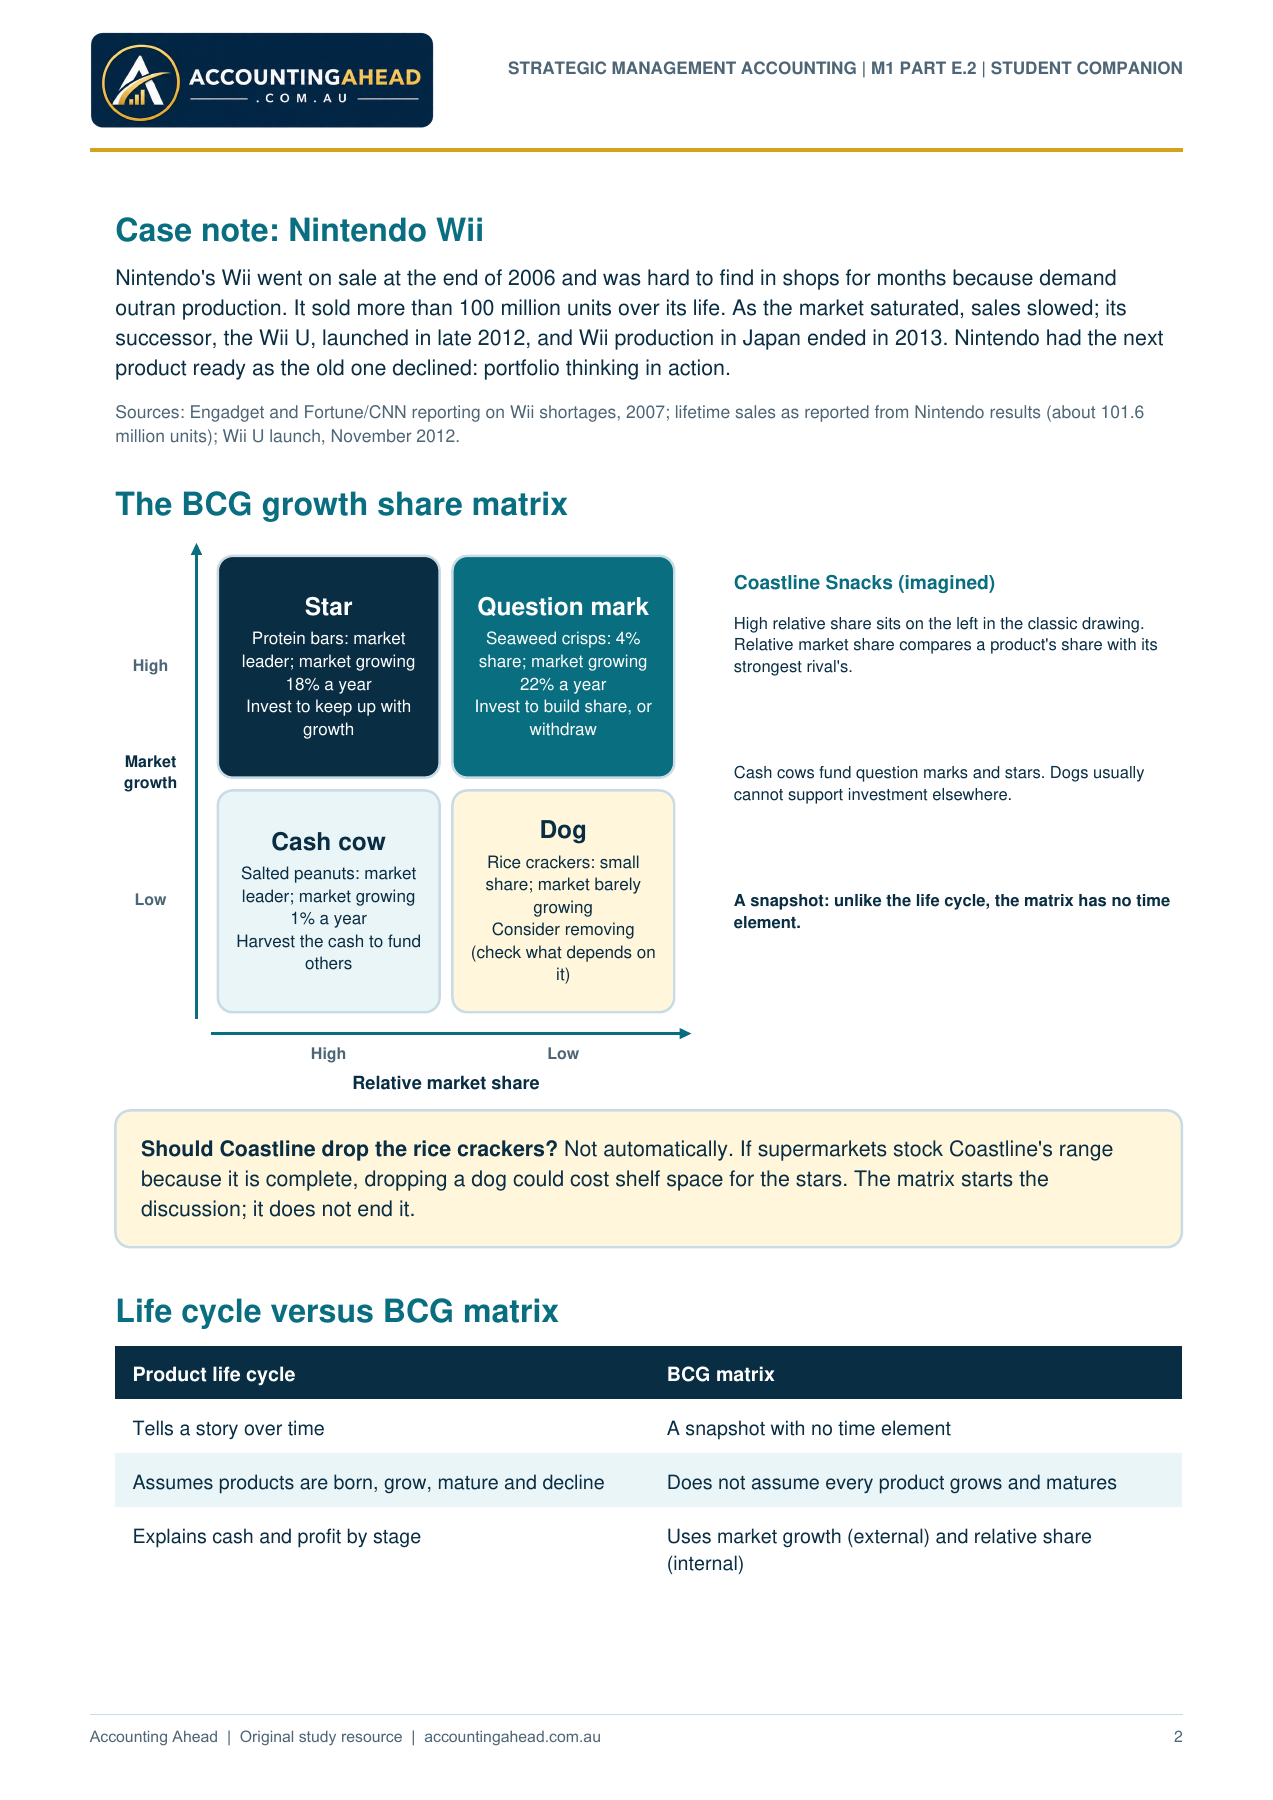
The BCG growth share matrix
Star
Protein bars: market
leader; market growing
18% a year
Invest to keep up with
growth
Question mark
Seaweed crisps: 4%
share; market growing
22% a year
Invest to build share, or
withdraw
Cash cow
Salted peanuts: market
leader; market growing
1% a year
Harvest the cash to fund
others
Dog
Rice crackers: small
share; market barely
growing
Consider removing
(check what depends on
it)
High Low
Relative market share
High
Low
Market
growth
Coastline Snacks (imagined)
High relative share sits on the left in the classic drawing.
Relative market share compares a product's share with its
strongest rival's.
Cash cows fund question marks and stars. Dogs usually
cannot support investment elsewhere.
A snapshot: unlike the life cycle, the matrix has no time
element.
Should Coastline drop the rice crackers? Not automatically. If supermarkets stock Coastline's range
because it is complete, dropping a dog could cost shelf space for the stars. The matrix starts the
discussion; it does not end it.
Life cycle versus BCG matrix
Product life cycle BCG matrix
Tells a story over time A snapshot with no time element
Assumes products are born, grow, mature and decline Does not assume every product grows and matures
Explains cash and profit by stage Uses market growth (external) and relative share
(internal)
STRATEGIC MANAGEMENT ACCOUNTING | M1 PART E.2 | STUDENT COMPANION
2
Accounting Ahead | Original study resource | accountingahead.com.au
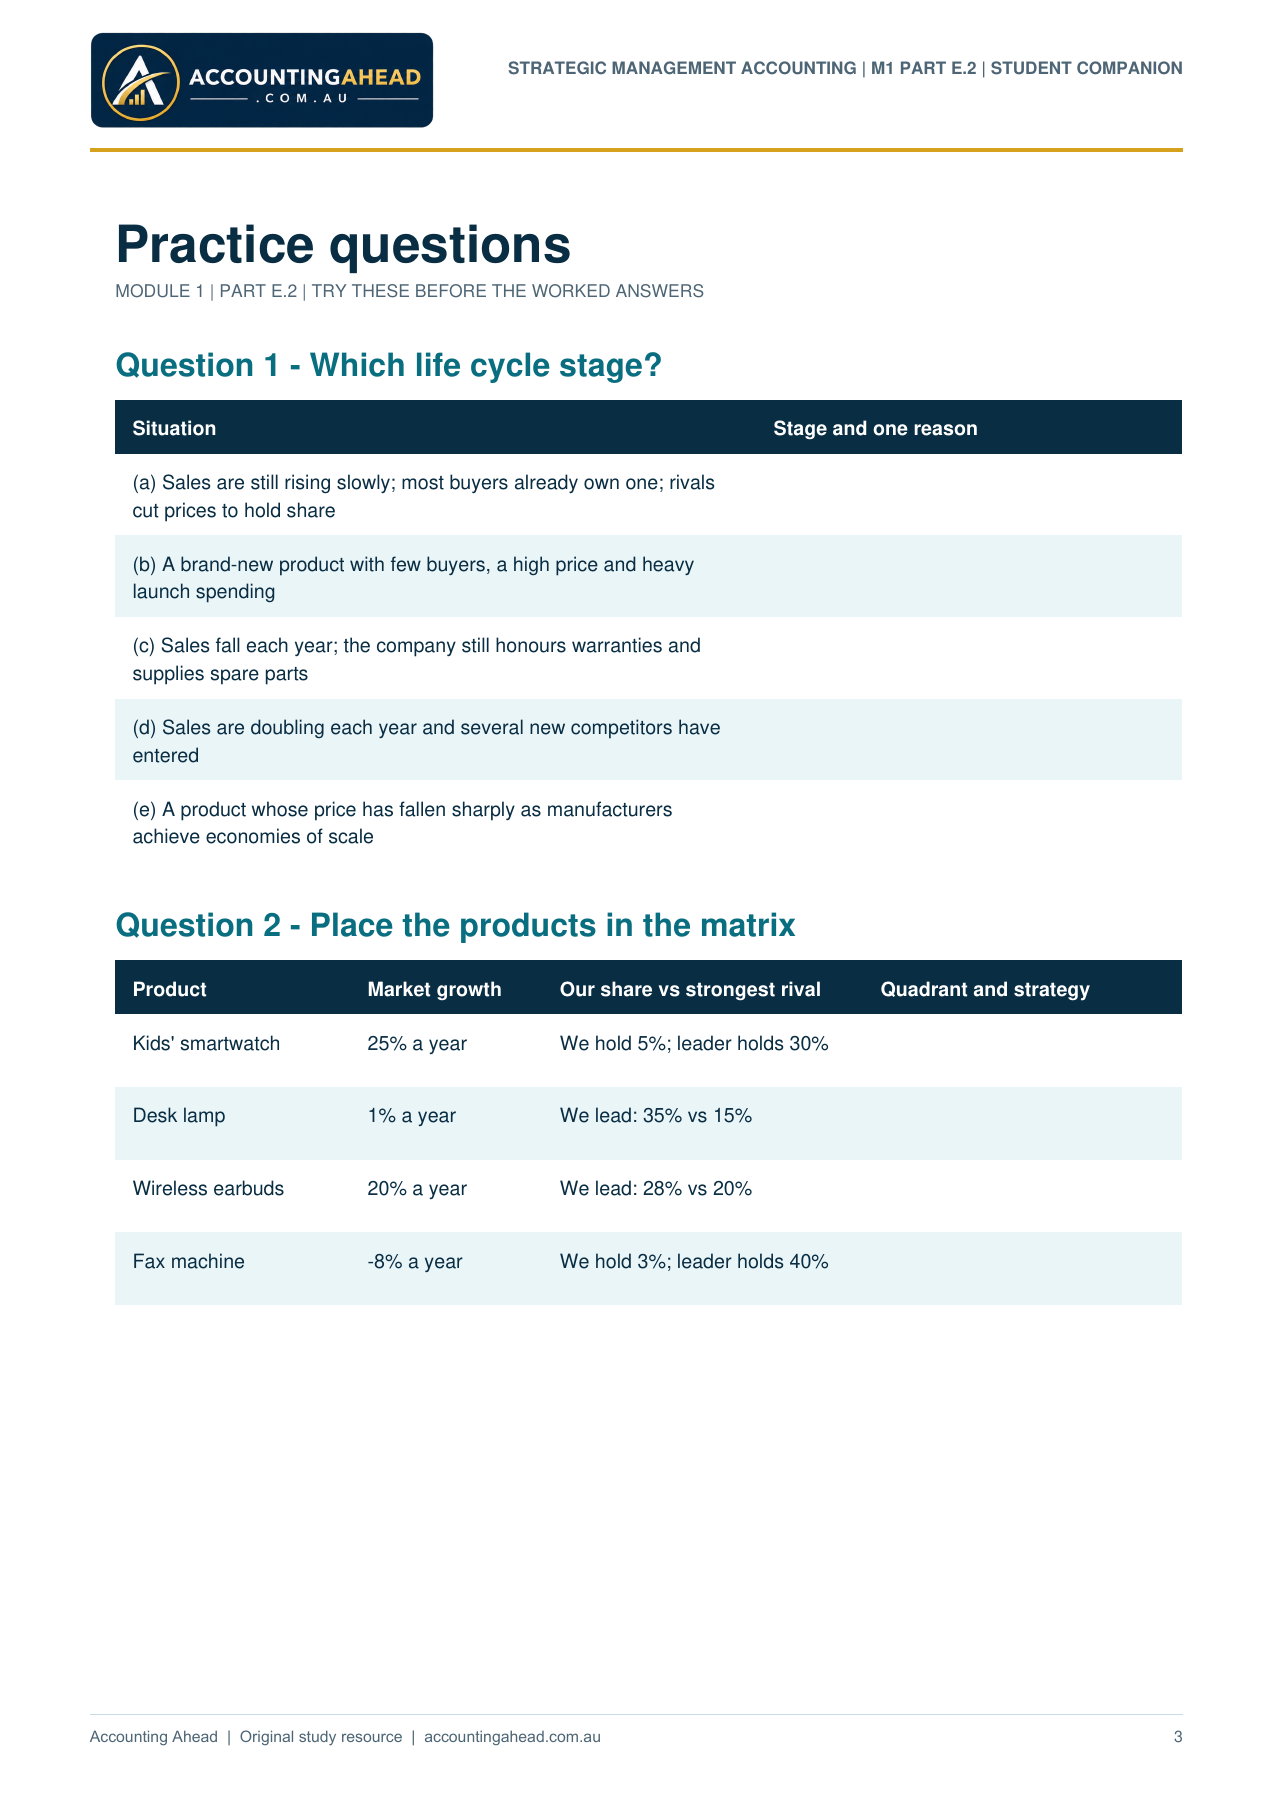
Practice questions
MODULE 1 | PART E.2 | TRY THESE BEFORE THE WORKED ANSWERS
Question 1 - Which life cycle stage?
Situation Stage and one reason
(a) Sales are still rising slowly; most buyers already own one; rivals
cut prices to hold share
(b) A brand-new product with few buyers, a high price and heavy
launch spending
(c) Sales fall each year; the company still honours warranties and
supplies spare parts
(d) Sales are doubling each year and several new competitors have
entered
(e) A product whose price has fallen sharply as manufacturers
achieve economies of scale
Question 2 - Place the products in the matrix
Product Market growth Our share vs strongest rival Quadrant and strategy
Kids' smartwatch 25% a year We hold 5%; leader holds 30%
Desk lamp 1% a year We lead: 35% vs 15%
Wireless earbuds 20% a year We lead: 28% vs 20%
Fax machine -8% a year We hold 3%; leader holds 40%
STRATEGIC MANAGEMENT ACCOUNTING | M1 PART E.2 | STUDENT COMPANION
3
Accounting Ahead | Original study resource | accountingahead.com.au
Question 3 - Only stars?
A company's portfolio consists entirely of stars. Explain why this could be dangerous, using both the life cycle
and the BCG matrix.
STRATEGIC MANAGEMENT ACCOUNTING | M1 PART E.2 | STUDENT COMPANION
4
Accounting Ahead | Original study resource | accountingahead.com.au
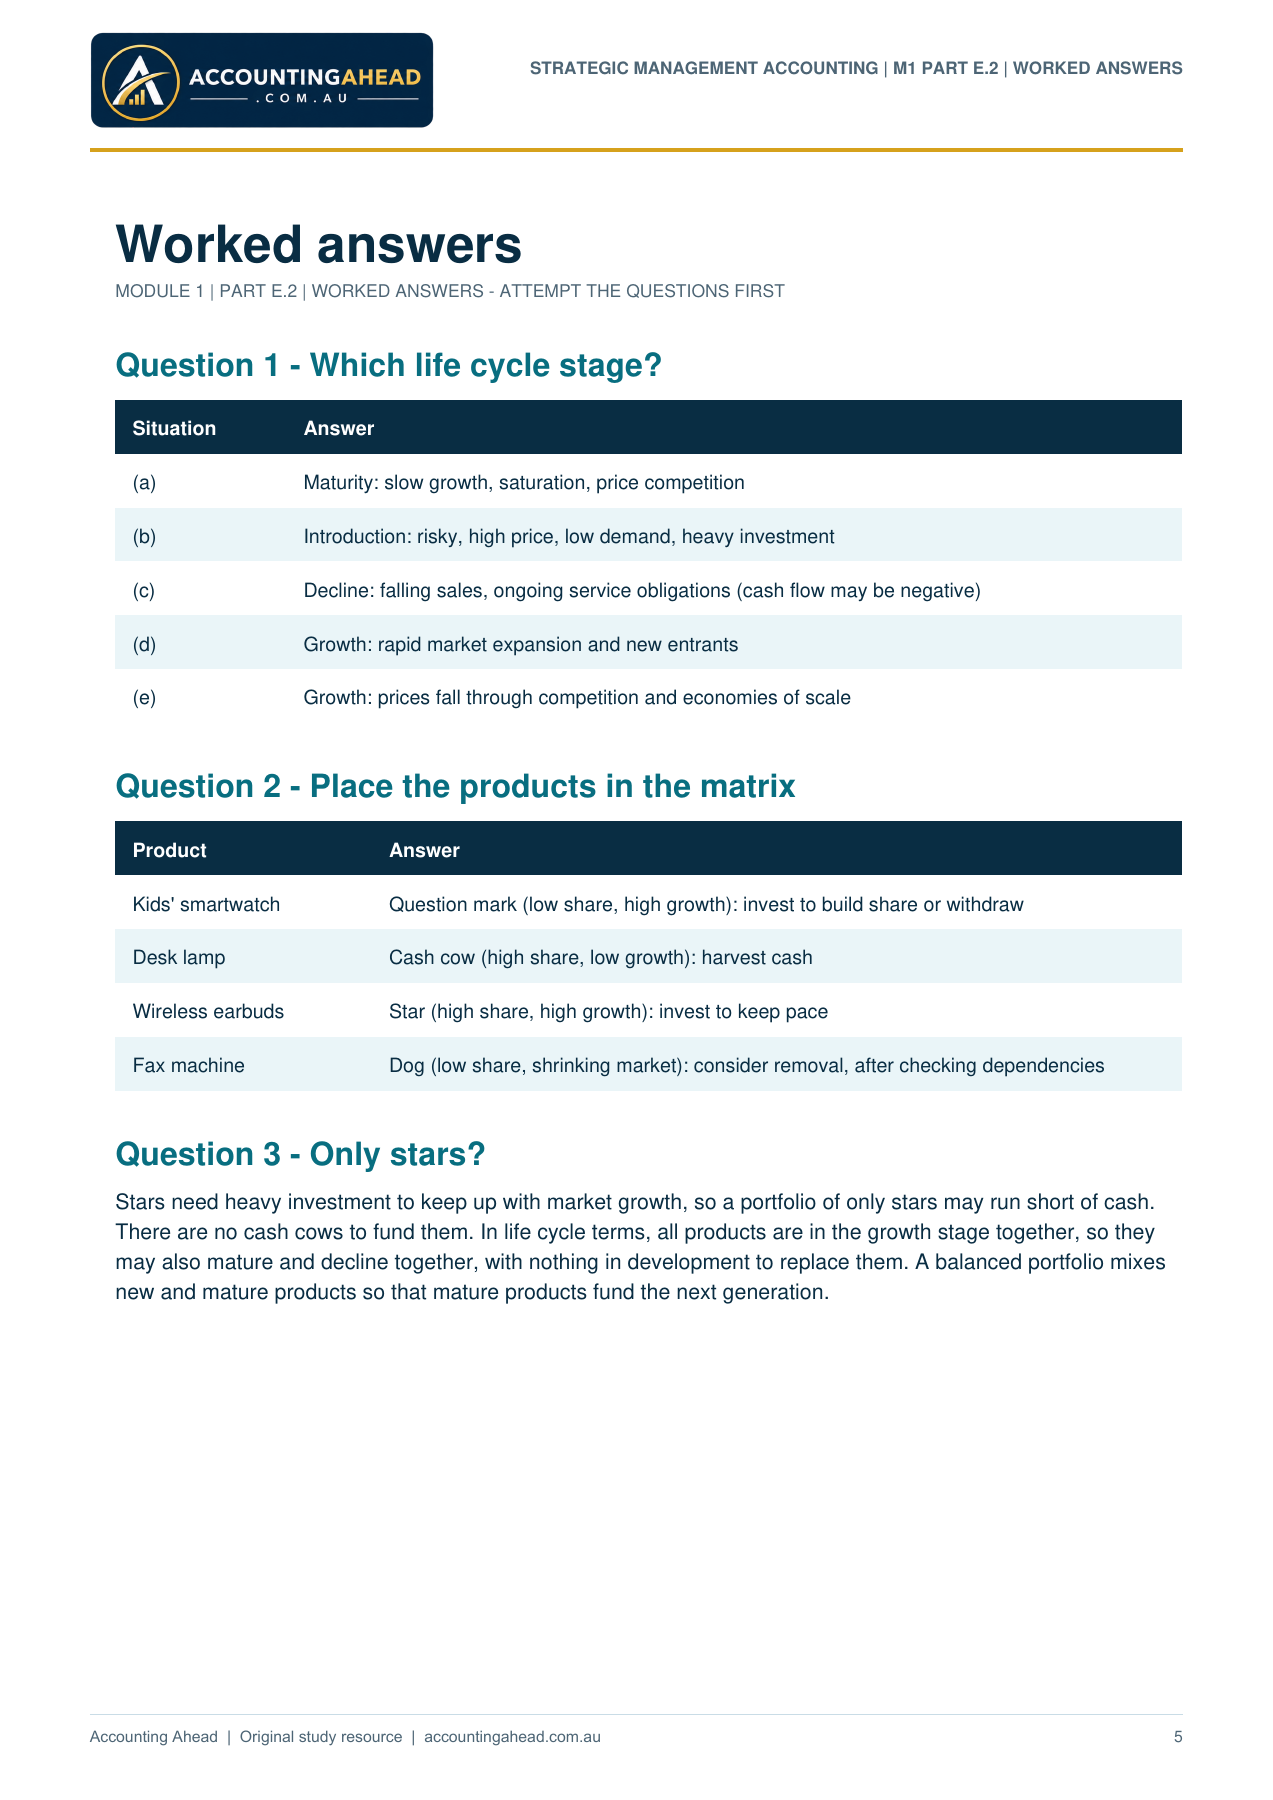
Worked answers
MODULE 1 | PART E.2 | WORKED ANSWERS - ATTEMPT THE QUESTIONS FIRST
Question 1 - Which life cycle stage?
Situation Answer
(a) Maturity: slow growth, saturation, price competition
(b) Introduction: risky, high price, low demand, heavy investment
(c) Decline: falling sales, ongoing service obligations (cash flow may be negative)
(d) Growth: rapid market expansion and new entrants
(e) Growth: prices fall through competition and economies of scale
Question 2 - Place the products in the matrix
Product Answer
Kids' smartwatch Question mark (low share, high growth): invest to build share or withdraw
Desk lamp Cash cow (high share, low growth): harvest cash
Wireless earbuds Star (high share, high growth): invest to keep pace
Fax machine Dog (low share, shrinking market): consider removal, after checking dependencies
Question 3 - Only stars?
Stars need heavy investment to keep up with market growth, so a portfolio of only stars may run short of cash.
There are no cash cows to fund them. In life cycle terms, all products are in the growth stage together, so they
may also mature and decline together, with nothing in development to replace them. A balanced portfolio mixes
new and mature products so that mature products fund the next generation.
STRATEGIC MANAGEMENT ACCOUNTING | M1 PART E.2 | WORKED ANSWERS
5