
Operational drivers and performance measures
Printable study notes to use alongside Part 3.4.1.


Read the handout text
Accounting Ahead | Original study resource | accountingahead.com.au
Operational drivers and performance
measures
MODULE 3 | 3.4.1 | STUDENT COMPANION
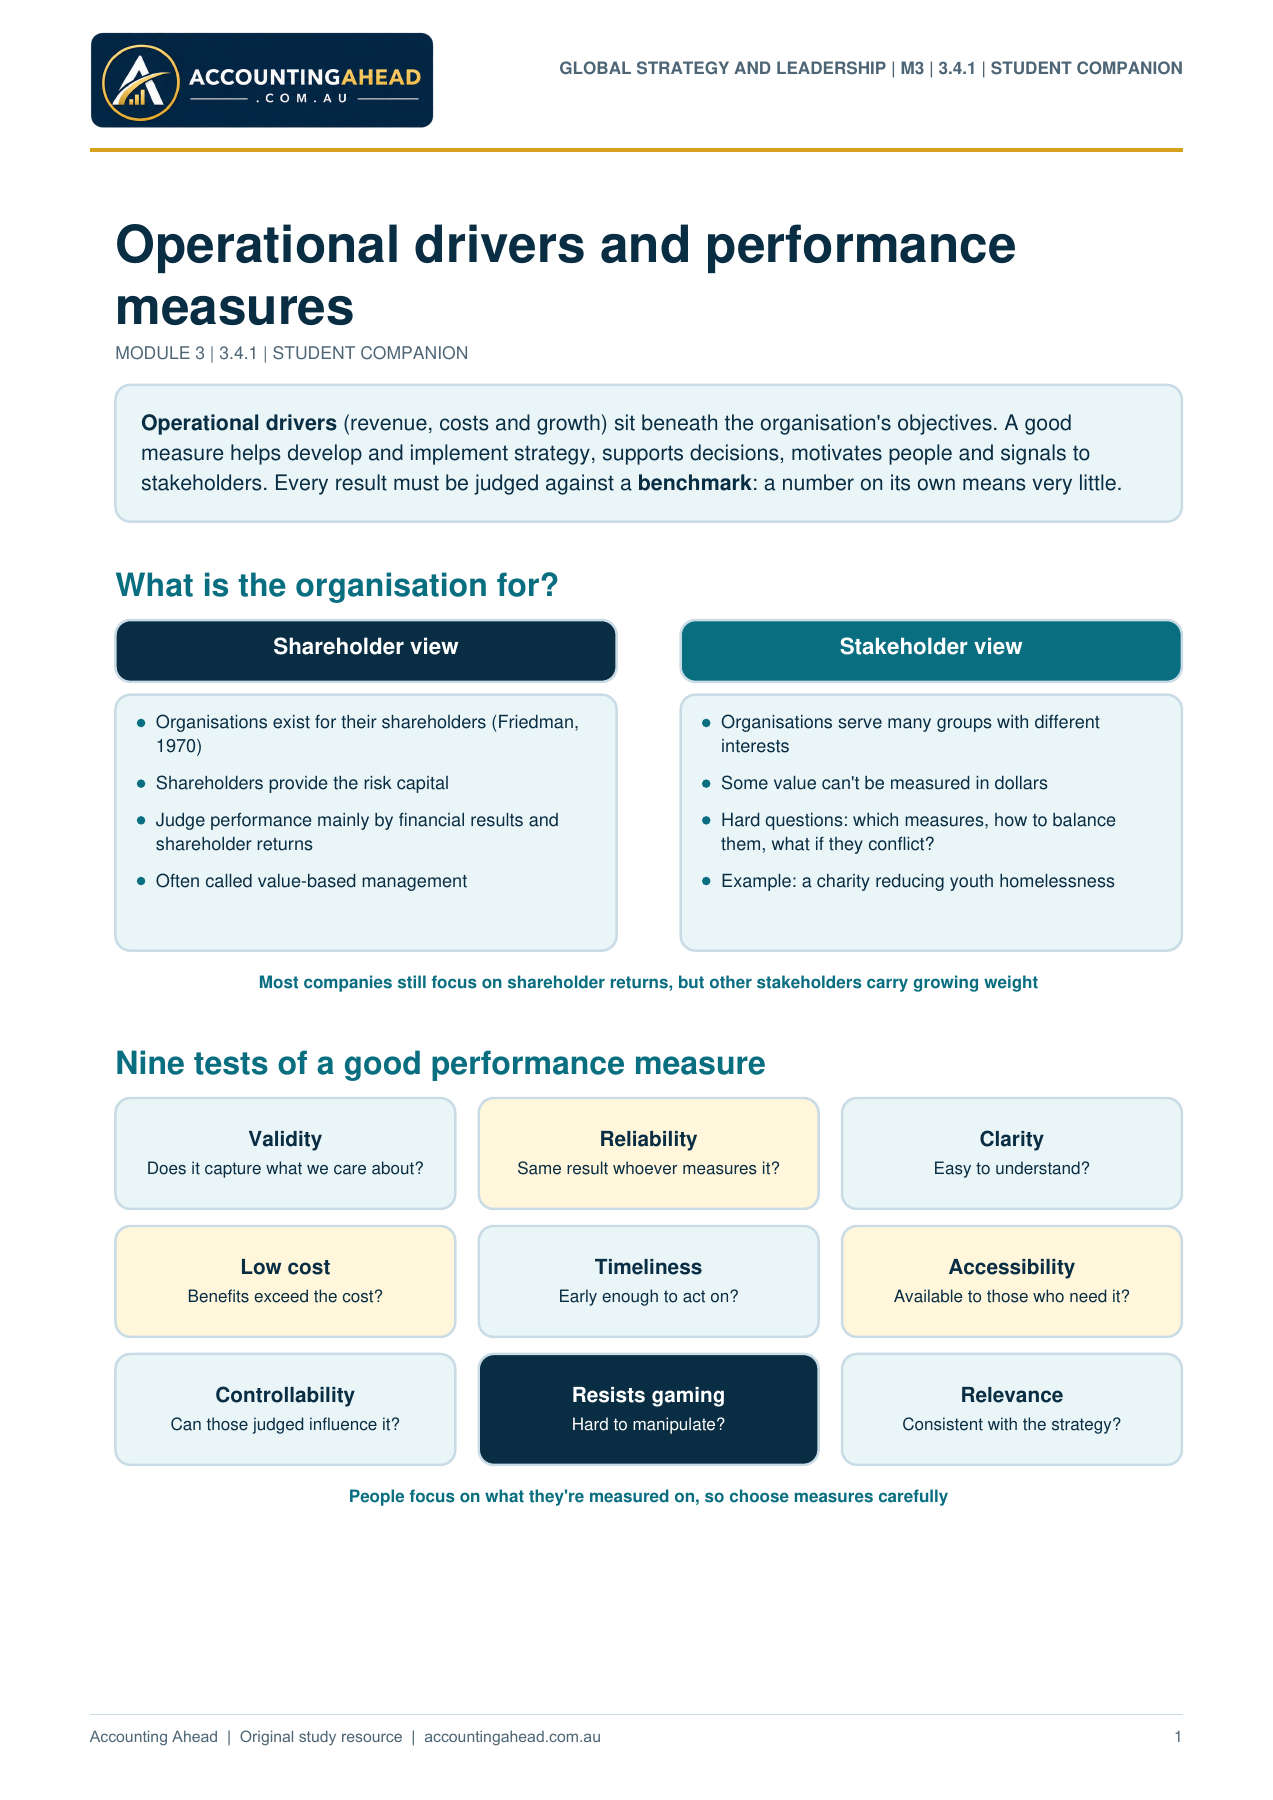
Operational drivers (revenue, costs and growth) sit beneath the organisation's objectives. A good
measure helps develop and implement strategy, supports decisions, motivates people and signals to
stakeholders. Every result must be judged against a benchmark: a number on its own means very little.
What is the organisation for?
Shareholder view
Organisations exist for their shareholders (Friedman,
1970)
Shareholders provide the risk capital
Judge performance mainly by financial results and
shareholder returns
Often called value-based management
Stakeholder view
Organisations serve many groups with different
interests
Some value can't be measured in dollars
Hard questions: which measures, how to balance
them, what if they conflict?
Example: a charity reducing youth homelessness
Most companies still focus on shareholder returns, but other stakeholders carry growing weight
Nine tests of a good performance measure
Validity
Does it capture what we care about?
Reliability
Same result whoever measures it?
Clarity
Easy to understand?
Low cost
Benefits exceed the cost?
Timeliness
Early enough to act on?
Accessibility
Available to those who need it?
Controllability
Can those judged influence it?
Resists gaming
Hard to manipulate?
Relevance
Consistent with the strategy?
People focus on what they're measured on, so choose measures carefully
GLOBAL STRATEGY AND LEADERSHIP | M3 | 3.4.1 | STUDENT COMPANION
1
Accounting Ahead | Original study resource | accountingahead.com.au
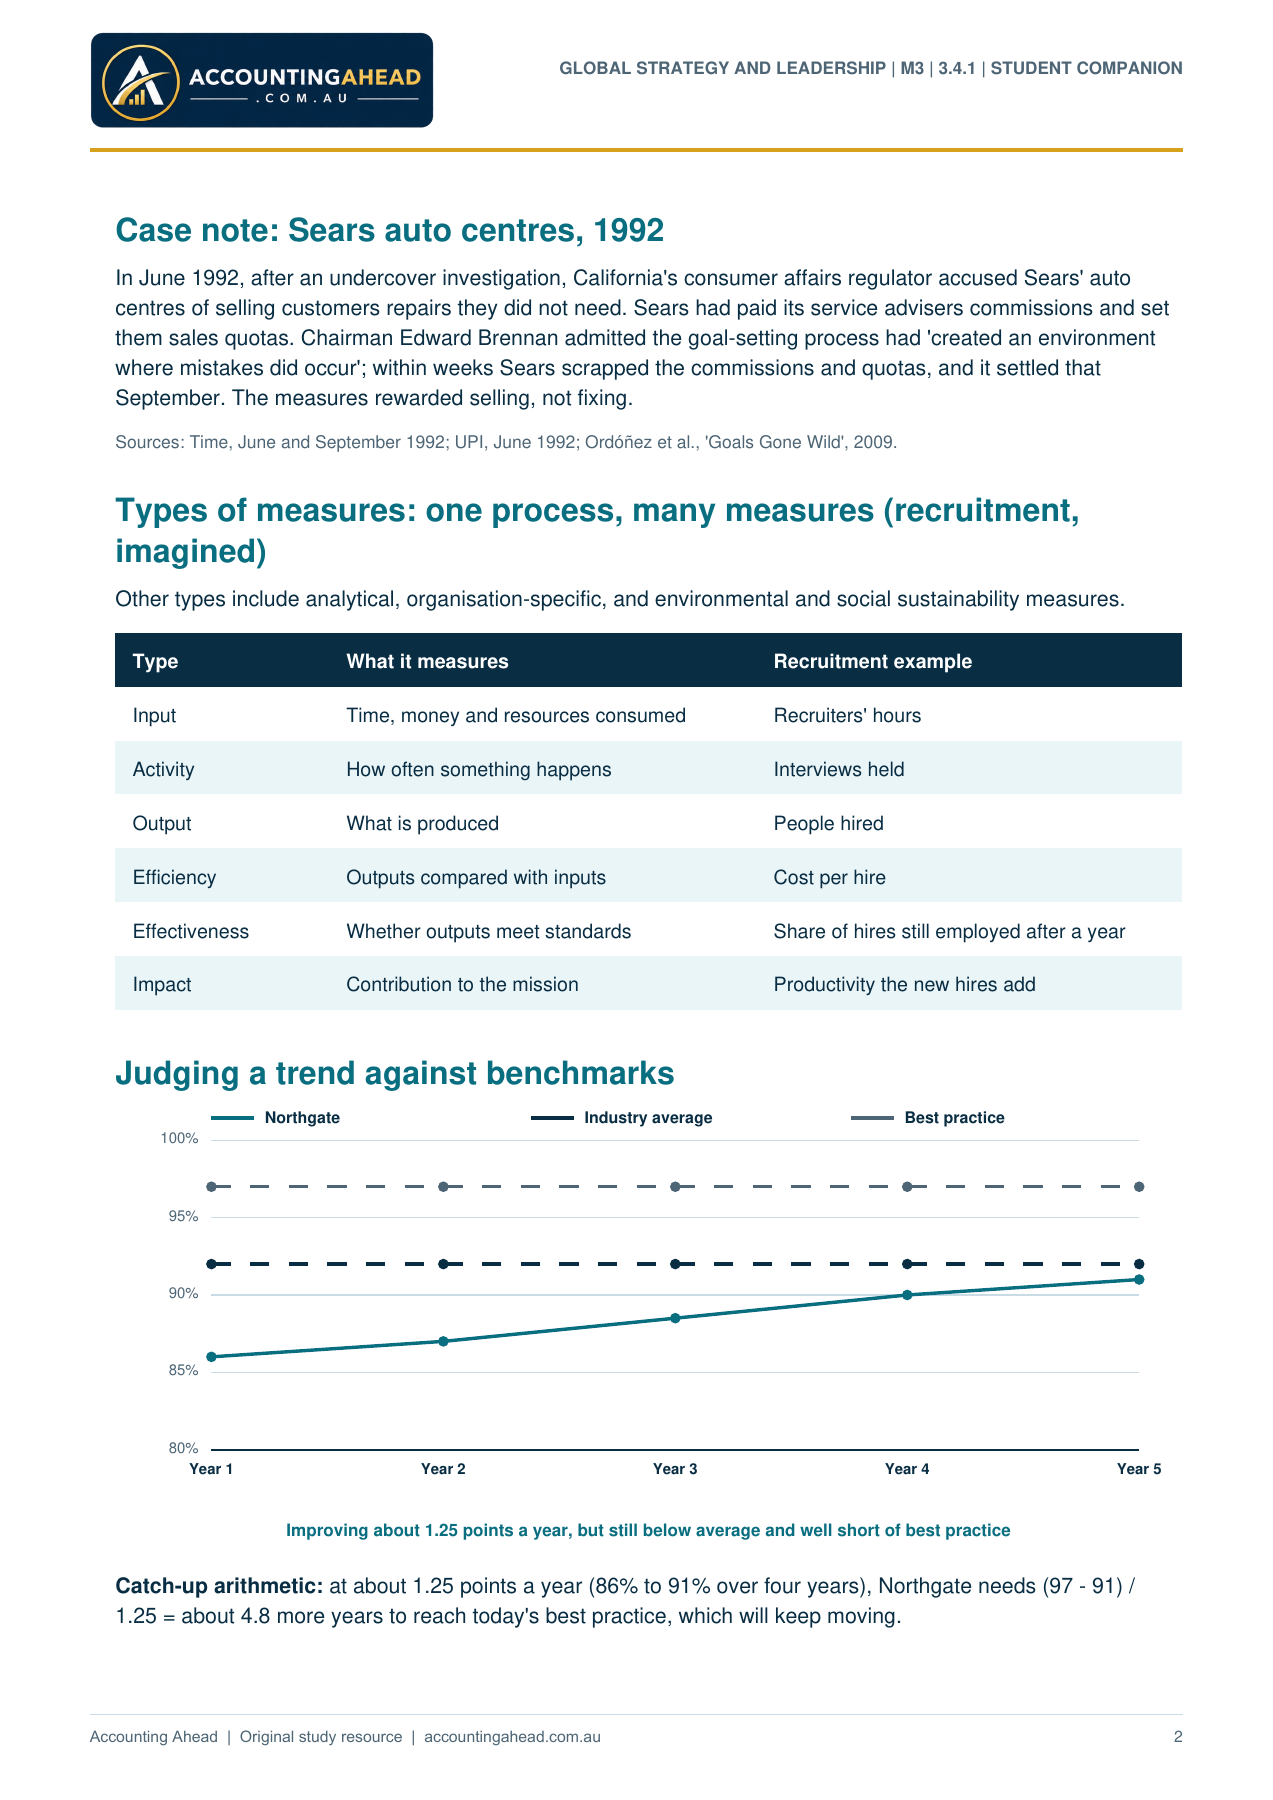
Case note: Sears auto centres, 1992
In June 1992, after an undercover investigation, California's consumer affairs regulator accused Sears' auto
centres of selling customers repairs they did not need. Sears had paid its service advisers commissions and set
them sales quotas. Chairman Edward Brennan admitted the goal-setting process had 'created an environment
where mistakes did occur'; within weeks Sears scrapped the commissions and quotas, and it settled that
September. The measures rewarded selling, not fixing.
Sources: Time, June and September 1992; UPI, June 1992; Ordóñez et al., 'Goals Gone Wild', 2009.
Types of measures: one process, many measures (recruitment,
imagined)
Other types include analytical, organisation-specific, and environmental and social sustainability measures.
Type What it measures Recruitment example
Input Time, money and resources consumed Recruiters' hours
Activity How often something happens Interviews held
Output What is produced People hired
Efficiency Outputs compared with inputs Cost per hire
Effectiveness Whether outputs meet standards Share of hires still employed after a year
Impact Contribution to the mission Productivity the new hires add
Judging a trend against benchmarks
80%
85%
90%
95%
100%
Year 1 Year 2 Year 3 Year 4 Year 5
Northgate Industry average Best practice
Improving about 1.25 points a year, but still below average and well short of best practice
Catch-up arithmetic: at about 1.25 points a year (86% to 91% over four years), Northgate needs (97 - 91) /
1.25 = about 4.8 more years to reach today's best practice, which will keep moving.
GLOBAL STRATEGY AND LEADERSHIP | M3 | 3.4.1 | STUDENT COMPANION
2
Accounting Ahead | Original study resource | accountingahead.com.au
Three kinds of benchmarking
Kind Compares Example
Internal Units within the organisation Branch A's processing time against Branch B's
Competitive The organisation with its direct rivals Our delivery times against our main
competitor's
Functional A process with whoever does it best, in any
industry
A hospital handover against a racing pit crew
Case note: Great Ormond Street Hospital and Ferrari
Doctors at London's Great Ormond Street Hospital, concerned about errors when children were handed over
from the operating theatre to intensive care, visited the Ferrari Formula One team to learn how its pit crew
managed fast, high-pressure handovers with clear roles, set sequences and a single leader, and also consulted
airline pilots. They redesigned their own handover. A 2007 study of 50 handovers found that average technical
errors fell from 5.4 to 3.2 per handover, and missed items of information from 2.1 to 1.1.
Source: K. Catchpole et al., 'Patient handover from surgery to intensive care: using Formula 1 pit-stop and aviation models to improve
safety and quality', Paediatric Anaesthesia, 2007.
GLOBAL STRATEGY AND LEADERSHIP | M3 | 3.4.1 | STUDENT COMPANION
3
Accounting Ahead | Original study resource | accountingahead.com.au
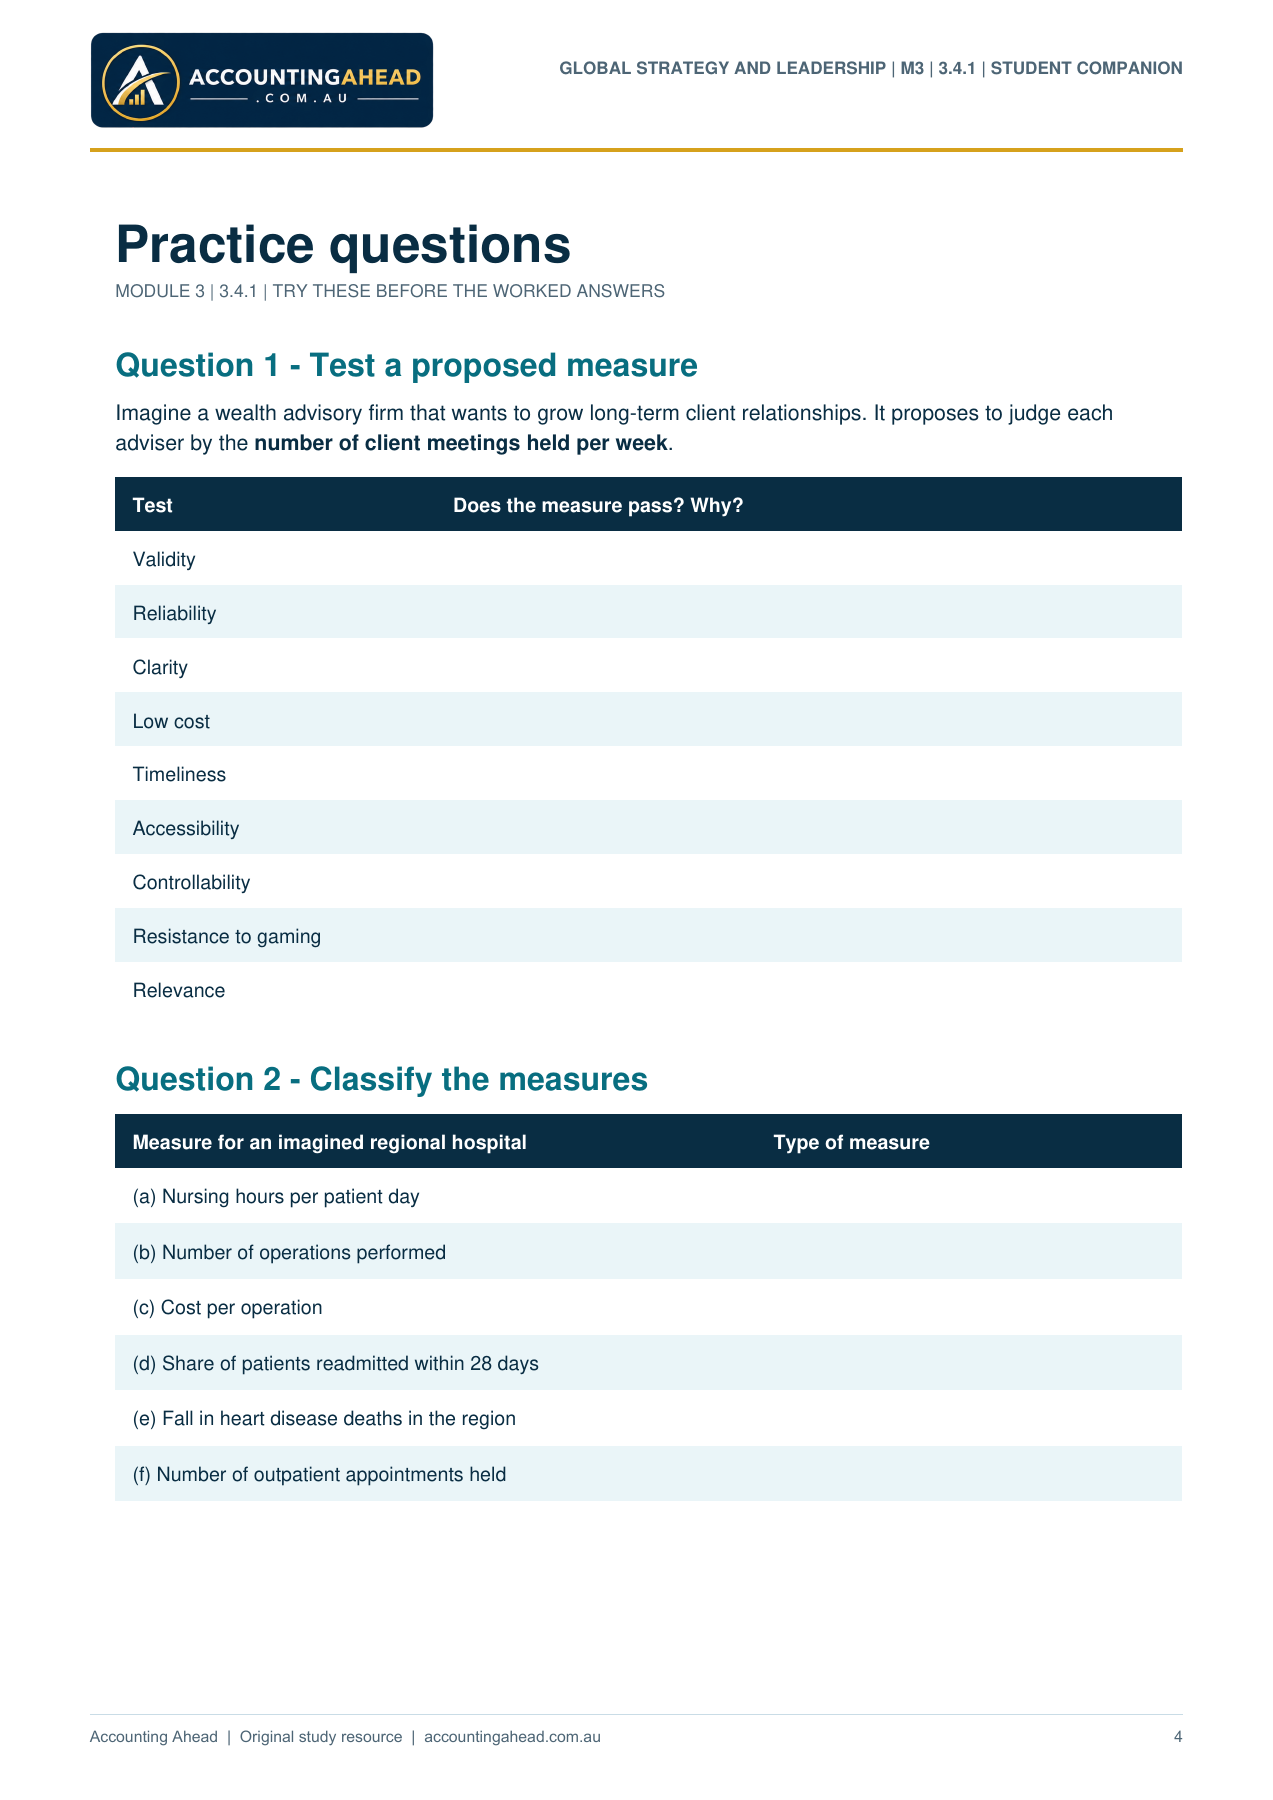
Practice questions
MODULE 3 | 3.4.1 | TRY THESE BEFORE THE WORKED ANSWERS
Question 1 - Test a proposed measure
Imagine a wealth advisory firm that wants to grow long-term client relationships. It proposes to judge each
adviser by the number of client meetings held per week.
Test Does the measure pass? Why?
Validity
Reliability
Clarity
Low cost
Timeliness
Accessibility
Controllability
Resistance to gaming
Relevance
Question 2 - Classify the measures
Measure for an imagined regional hospital Type of measure
(a) Nursing hours per patient day
(b) Number of operations performed
(c) Cost per operation
(d) Share of patients readmitted within 28 days
(e) Fall in heart disease deaths in the region
(f) Number of outpatient appointments held
GLOBAL STRATEGY AND LEADERSHIP | M3 | 3.4.1 | STUDENT COMPANION
4
Accounting Ahead | Original study resource | accountingahead.com.au
Question 3 - Judge the result
Imagine an insurer whose customer satisfaction has risen from 78% to 84% over three years. Its internal target
is 85%, the industry average is 86% and the best performer achieves 93%. Judge its performance, using both
the trend and the benchmarks, and say what you would recommend.
GLOBAL STRATEGY AND LEADERSHIP | M3 | 3.4.1 | STUDENT COMPANION
5
Accounting Ahead | Original study resource | accountingahead.com.au
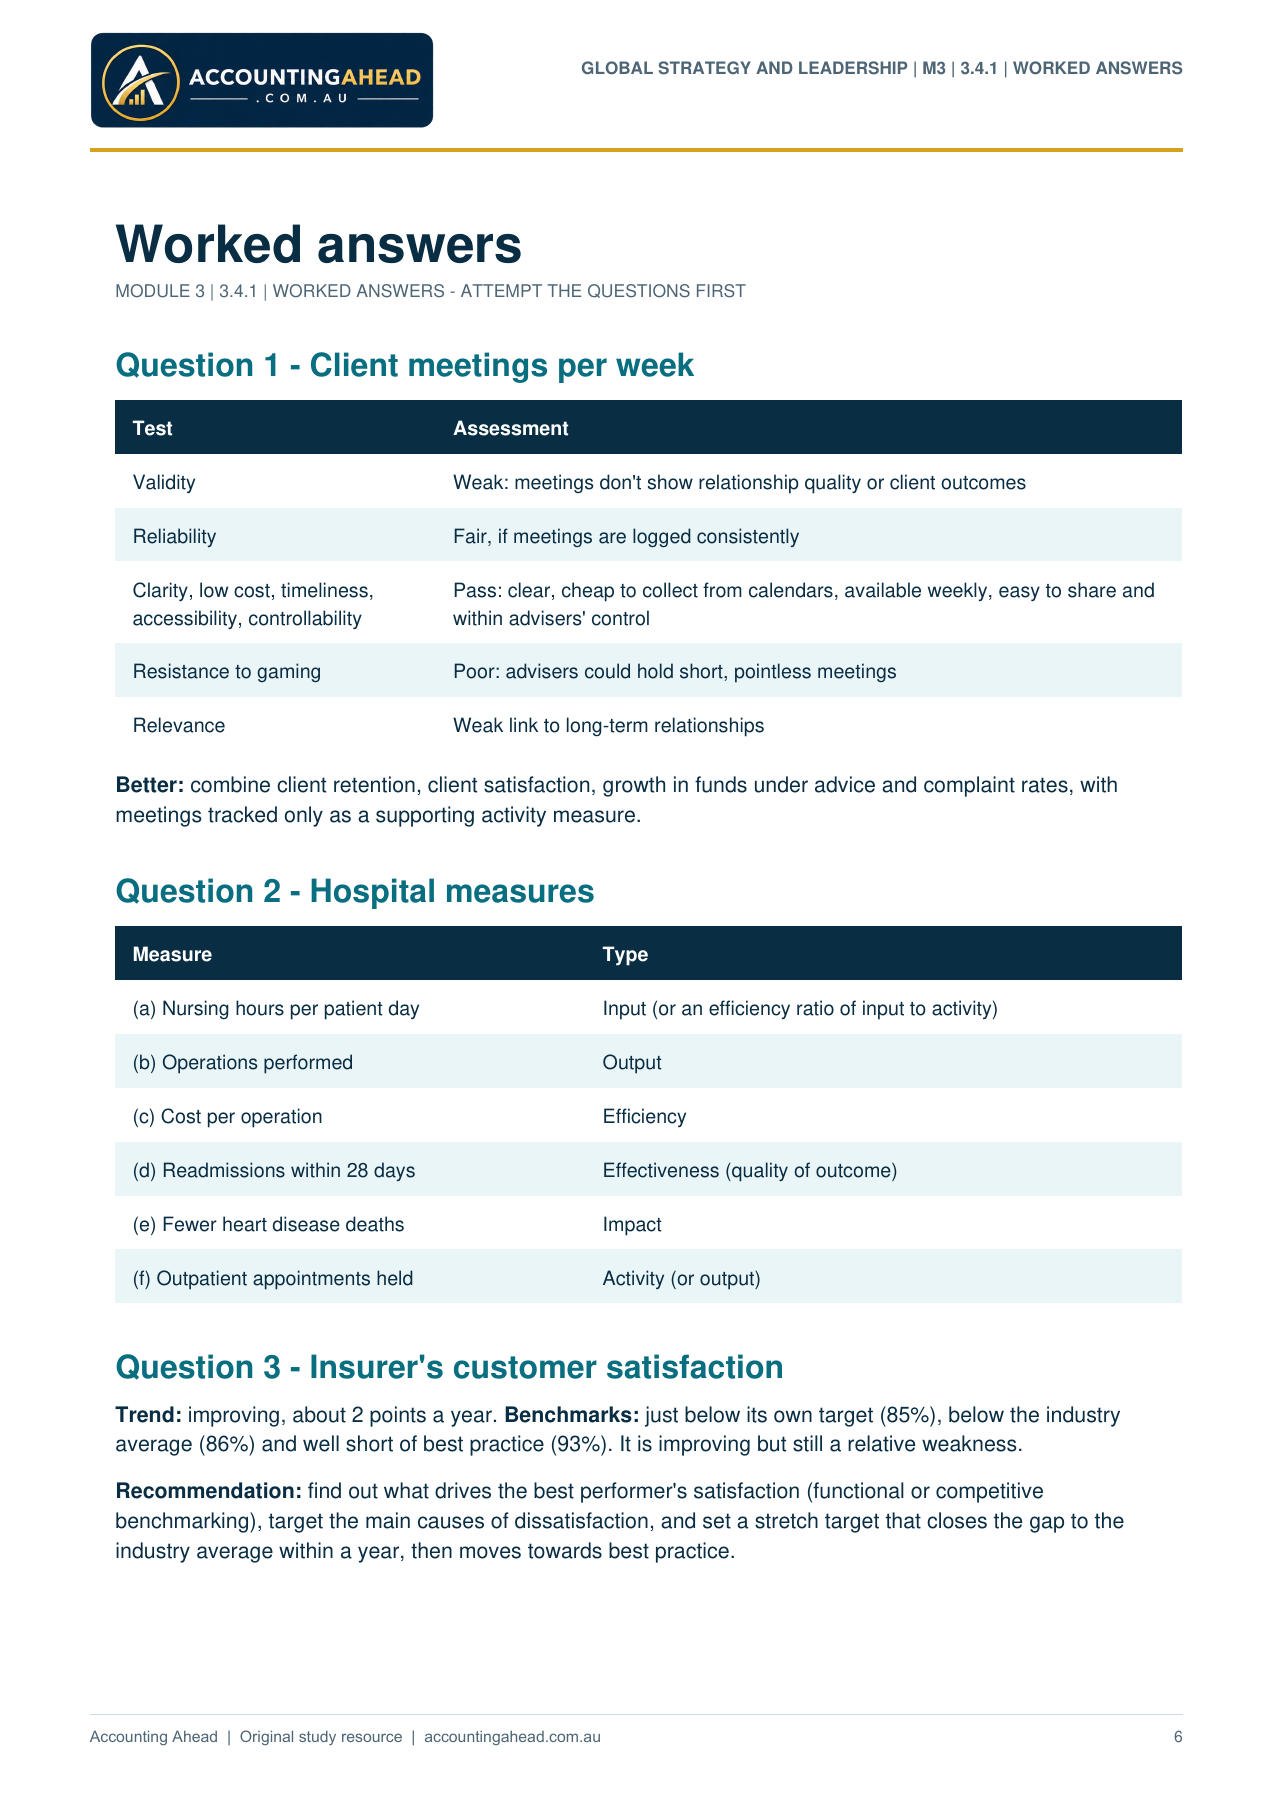
Worked answers
MODULE 3 | 3.4.1 | WORKED ANSWERS - ATTEMPT THE QUESTIONS FIRST
Question 1 - Client meetings per week
Test Assessment
Validity Weak: meetings don't show relationship quality or client outcomes
Reliability Fair, if meetings are logged consistently
Clarity, low cost, timeliness,
accessibility, controllability
Pass: clear, cheap to collect from calendars, available weekly, easy to share and
within advisers' control
Resistance to gaming Poor: advisers could hold short, pointless meetings
Relevance Weak link to long-term relationships
Better: combine client retention, client satisfaction, growth in funds under advice and complaint rates, with
meetings tracked only as a supporting activity measure.
Question 2 - Hospital measures
Measure Type
(a) Nursing hours per patient day Input (or an efficiency ratio of input to activity)
(b) Operations performed Output
(c) Cost per operation Efficiency
(d) Readmissions within 28 days Effectiveness (quality of outcome)
(e) Fewer heart disease deaths Impact
(f) Outpatient appointments held Activity (or output)
Question 3 - Insurer's customer satisfaction
Trend: improving, about 2 points a year. Benchmarks: just below its own target (85%), below the industry
average (86%) and well short of best practice (93%). It is improving but still a relative weakness.
Recommendation: find out what drives the best performer's satisfaction (functional or competitive
benchmarking), target the main causes of dissatisfaction, and set a stretch target that closes the gap to the
industry average within a year, then moves towards best practice.
GLOBAL STRATEGY AND LEADERSHIP | M3 | 3.4.1 | WORKED ANSWERS
6