
The balanced scorecard
Printable study notes to use alongside Part 3.4.2.

Read the handout text
Accounting Ahead | Original study resource | accountingahead.com.au
The balanced scorecard
MODULE 3 | 3.4.2 | STUDENT COMPANION
The balanced scorecard (Kaplan and Norton, Harvard Business Review, 1992; book 1996) measures
performance from four linked perspectives, balancing short and long term, external and internal, financial
and non-financial, and different stakeholders. It suits companies, not-for-profits and government agencies.
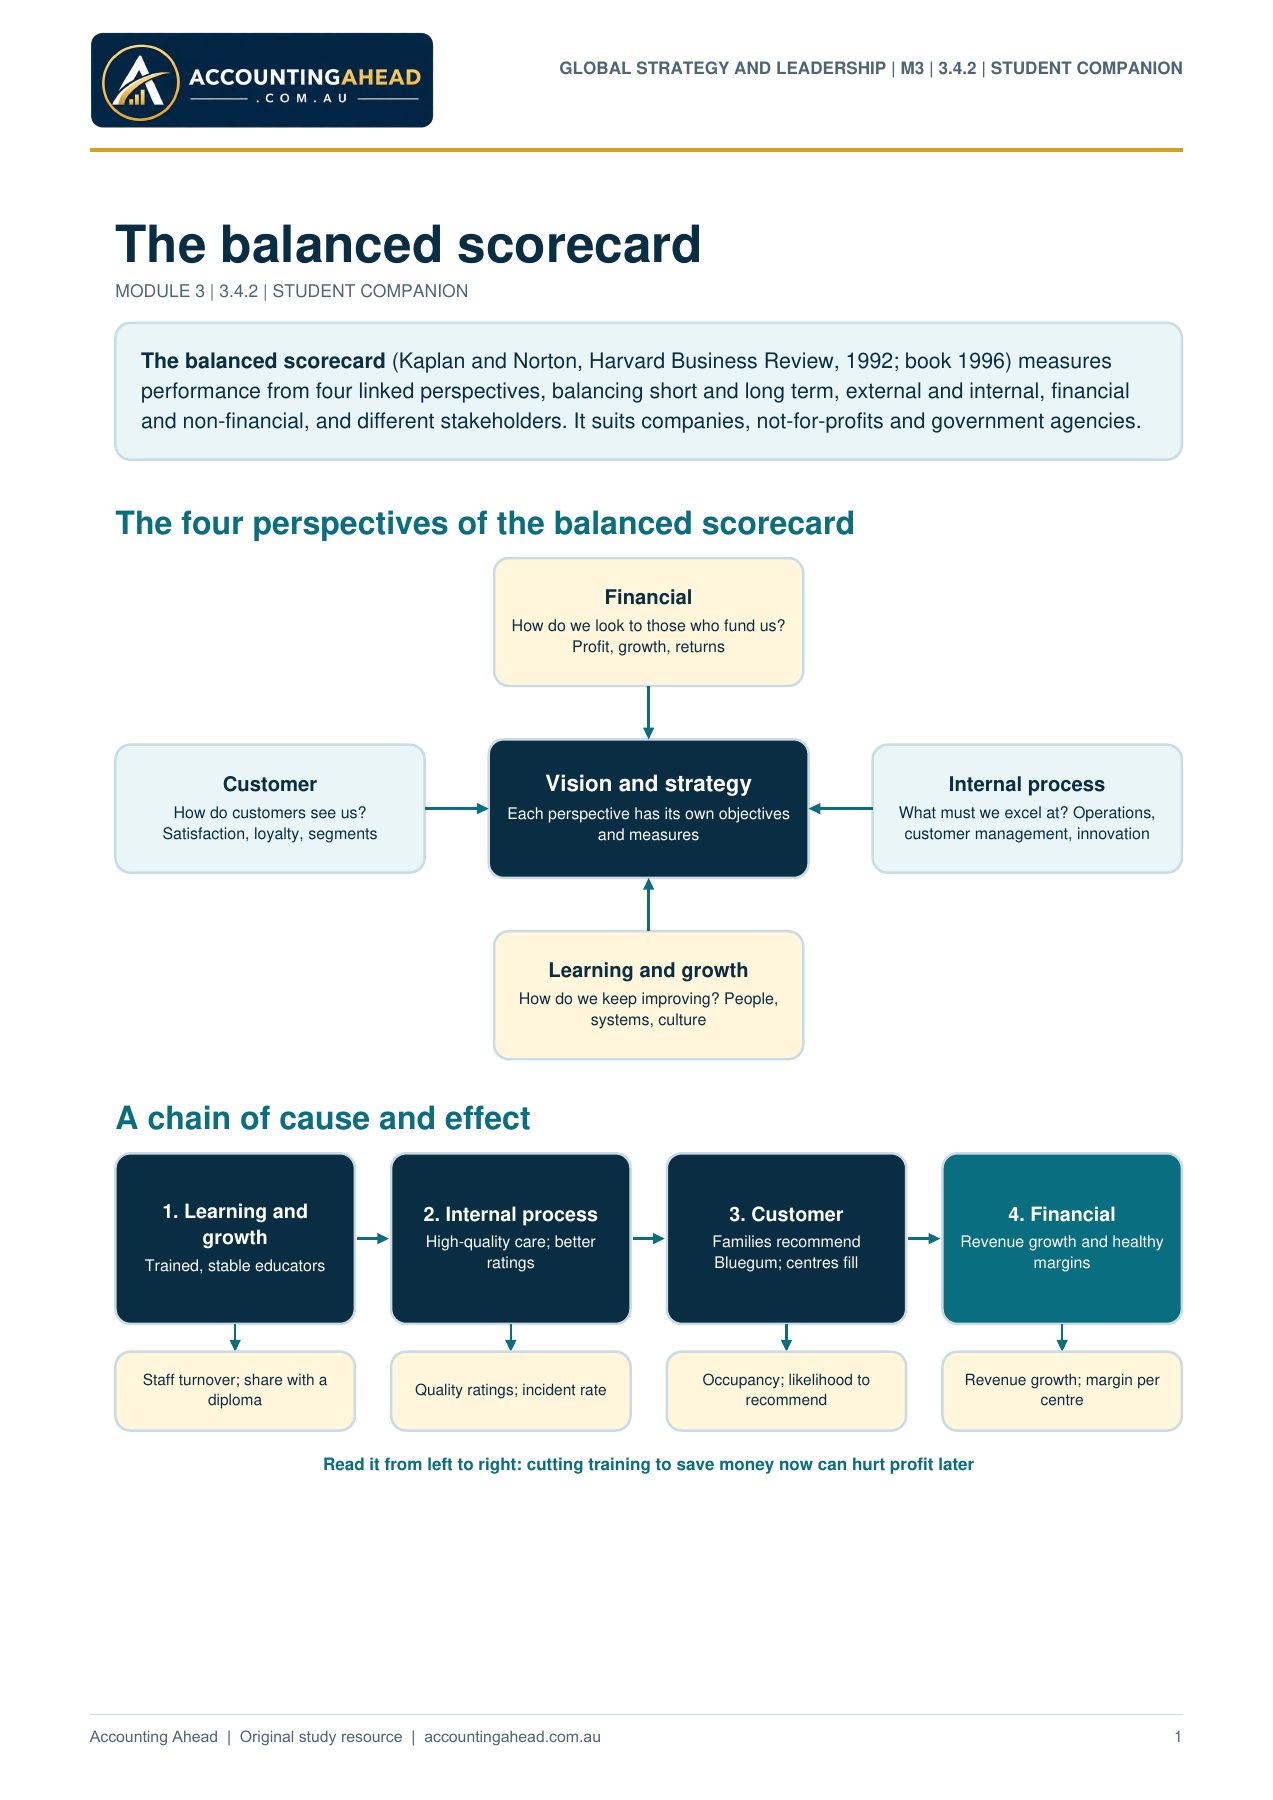
The four perspectives of the balanced scorecard
Vision and strategy
Each perspective has its own objectives
and measures
Customer
How do customers see us?
Satisfaction, loyalty, segments
Internal process
What must we excel at? Operations,
customer management, innovation
Financial
How do we look to those who fund us?
Profit, growth, returns
Learning and growth
How do we keep improving? People,
systems, culture
A chain of cause and effect
1. Learning and
growth
Trained, stable educators
Staff turnover; share with a
diploma
2. Internal process
High-quality care; better
ratings
Quality ratings; incident rate
3. Customer
Families recommend
Bluegum; centres fill
Occupancy; likelihood to
recommend
4. Financial
Revenue growth and healthy
margins
Revenue growth; margin per
centre
Read it from left to right: cutting training to save money now can hurt profit later
GLOBAL STRATEGY AND LEADERSHIP | M3 | 3.4.2 | STUDENT COMPANION
1
Accounting Ahead | Original study resource | accountingahead.com.au
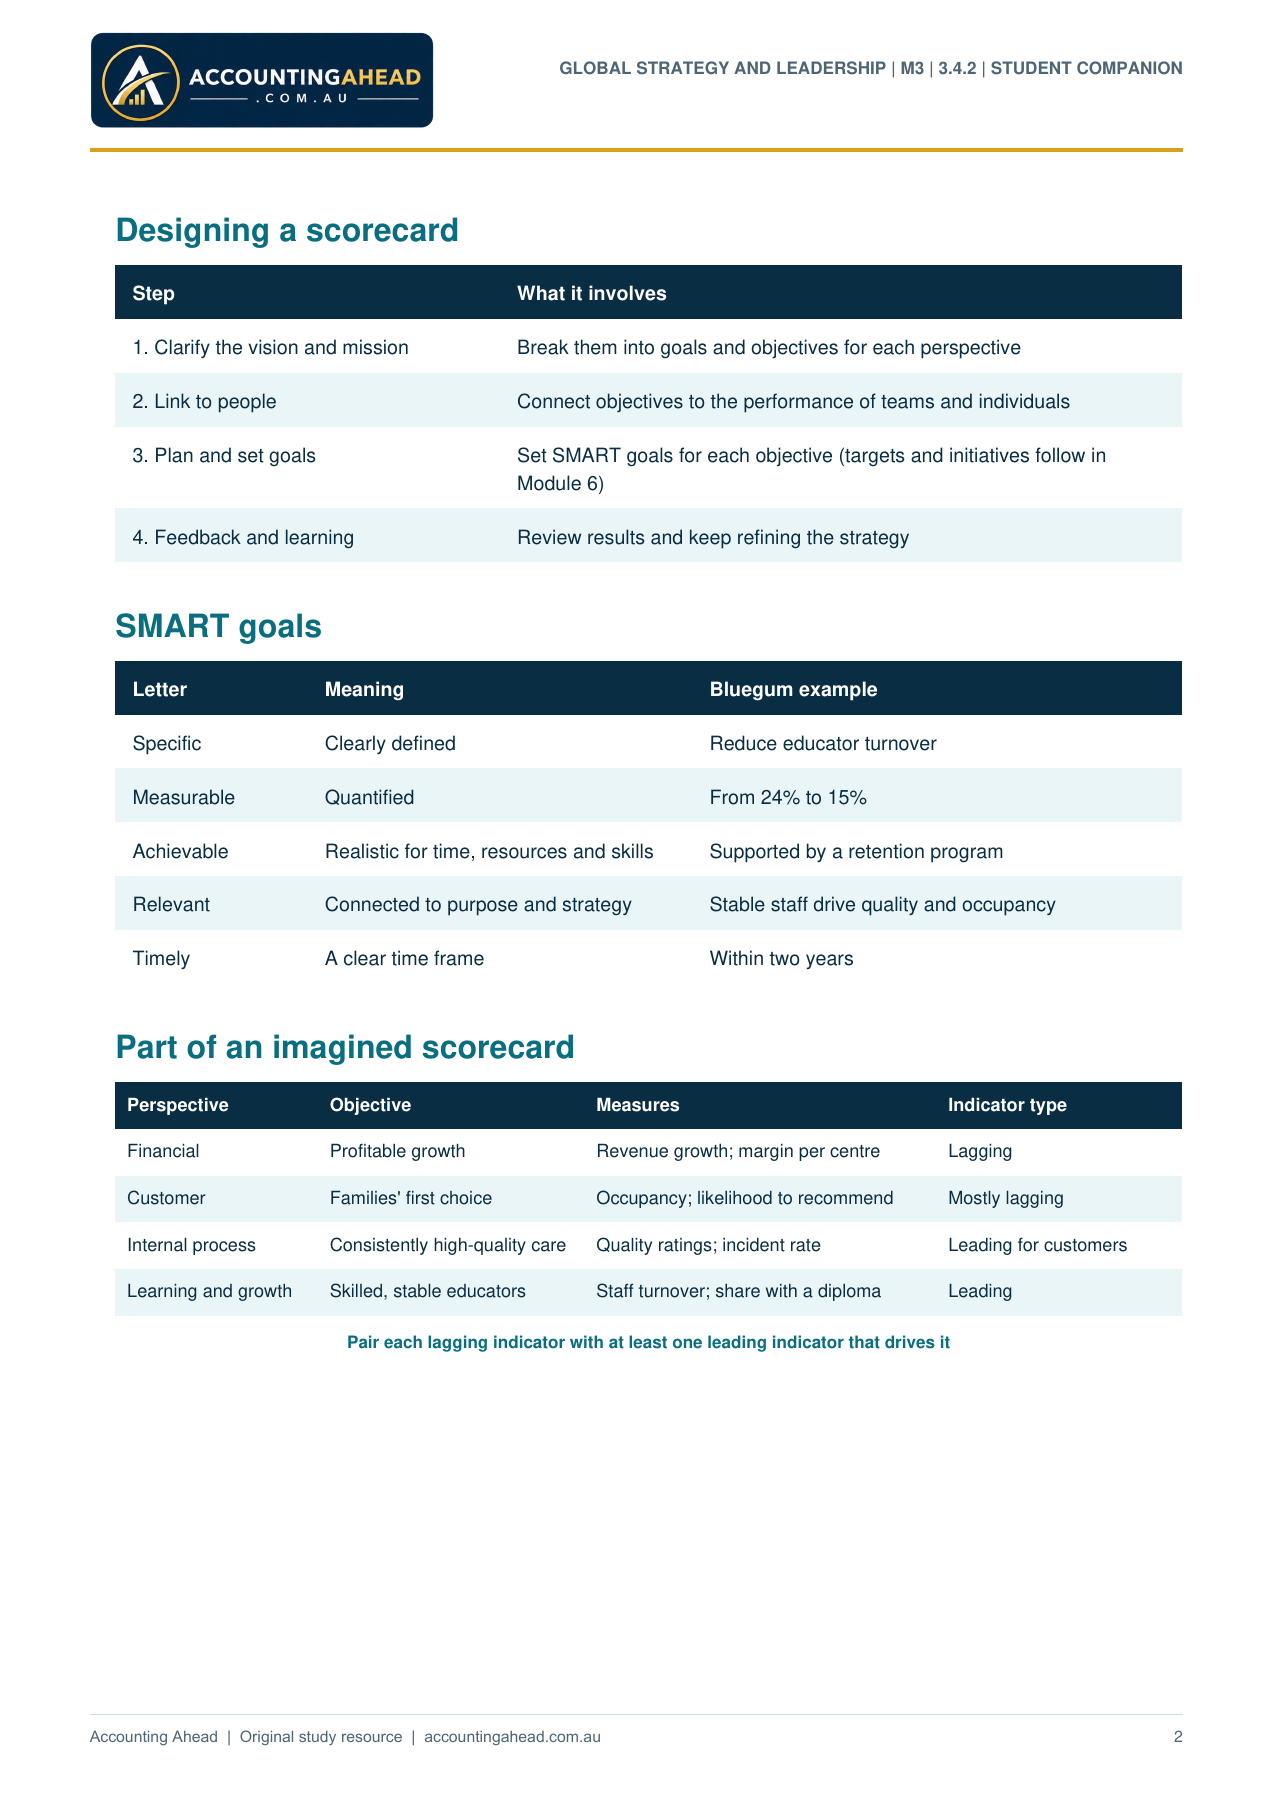
Designing a scorecard
Step What it involves
1. Clarify the vision and mission Break them into goals and objectives for each perspective
2. Link to people Connect objectives to the performance of teams and individuals
3. Plan and set goals Set SMART goals for each objective (targets and initiatives follow in
Module 6)
4. Feedback and learning Review results and keep refining the strategy
SMART goals
Letter Meaning Bluegum example
Specific Clearly defined Reduce educator turnover
Measurable Quantified From 24% to 15%
Achievable Realistic for time, resources and skills Supported by a retention program
Relevant Connected to purpose and strategy Stable staff drive quality and occupancy
Timely A clear time frame Within two years
Part of an imagined scorecard
Perspective Objective Measures Indicator type
Financial Profitable growth Revenue growth; margin per centre Lagging
Customer Families' first choice Occupancy; likelihood to recommend Mostly lagging
Internal process Consistently high-quality care Quality ratings; incident rate Leading for customers
Learning and growth Skilled, stable educators Staff turnover; share with a diploma Leading
Pair each lagging indicator with at least one leading indicator that drives it
GLOBAL STRATEGY AND LEADERSHIP | M3 | 3.4.2 | STUDENT COMPANION
2
Accounting Ahead | Original study resource | accountingahead.com.au
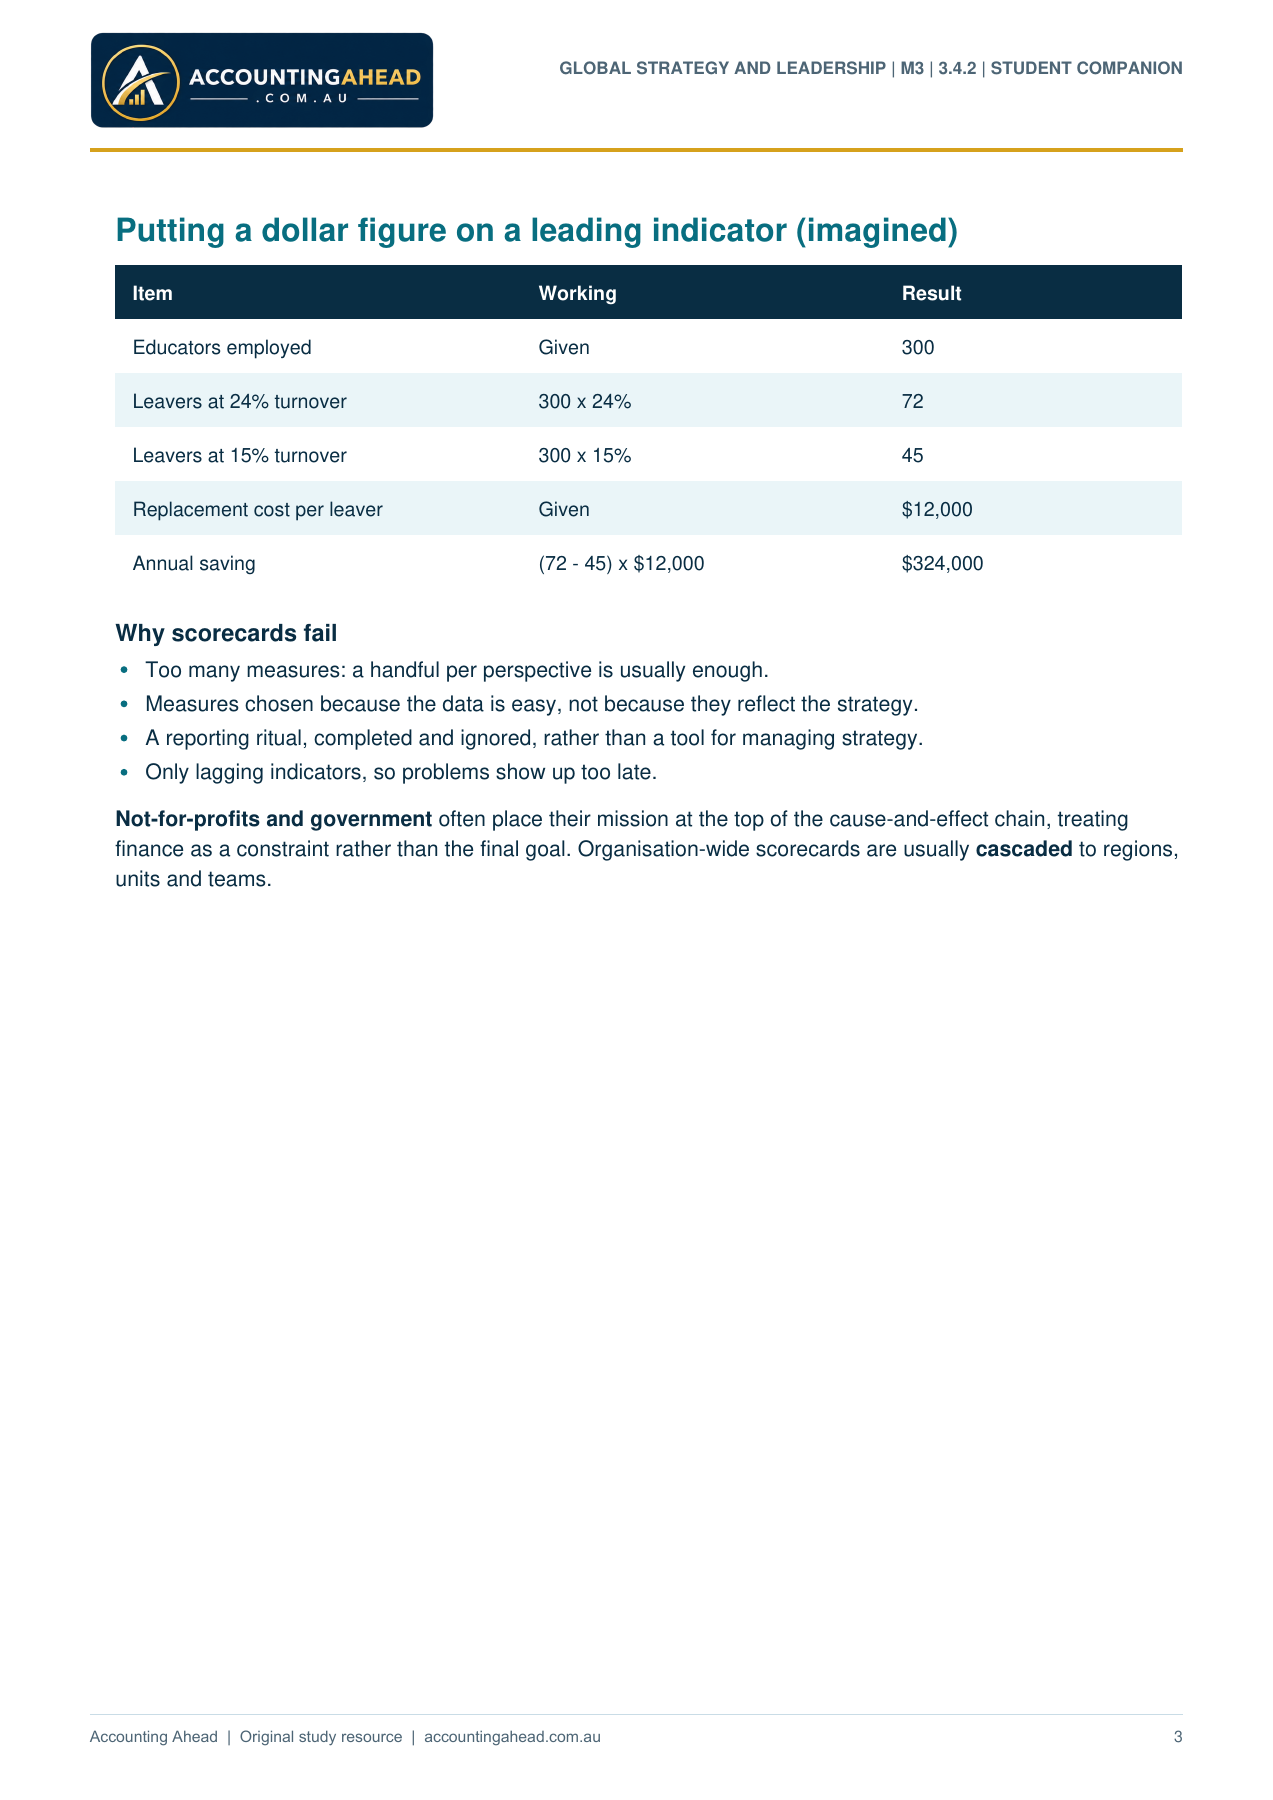
Putting a dollar figure on a leading indicator (imagined)
Item Working Result
Educators employed Given 300
Leavers at 24% turnover 300 x 24% 72
Leavers at 15% turnover 300 x 15% 45
Replacement cost per leaver Given $12,000
Annual saving (72 - 45) x $12,000 $324,000
Why scorecards fail
Too many measures: a handful per perspective is usually enough.
Measures chosen because the data is easy, not because they reflect the strategy.
A reporting ritual, completed and ignored, rather than a tool for managing strategy.
Only lagging indicators, so problems show up too late.
Not-for-profits and government often place their mission at the top of the cause-and-effect chain, treating
finance as a constraint rather than the final goal. Organisation-wide scorecards are usually cascaded to regions,
units and teams.
GLOBAL STRATEGY AND LEADERSHIP | M3 | 3.4.2 | STUDENT COMPANION
3
Accounting Ahead | Original study resource | accountingahead.com.au
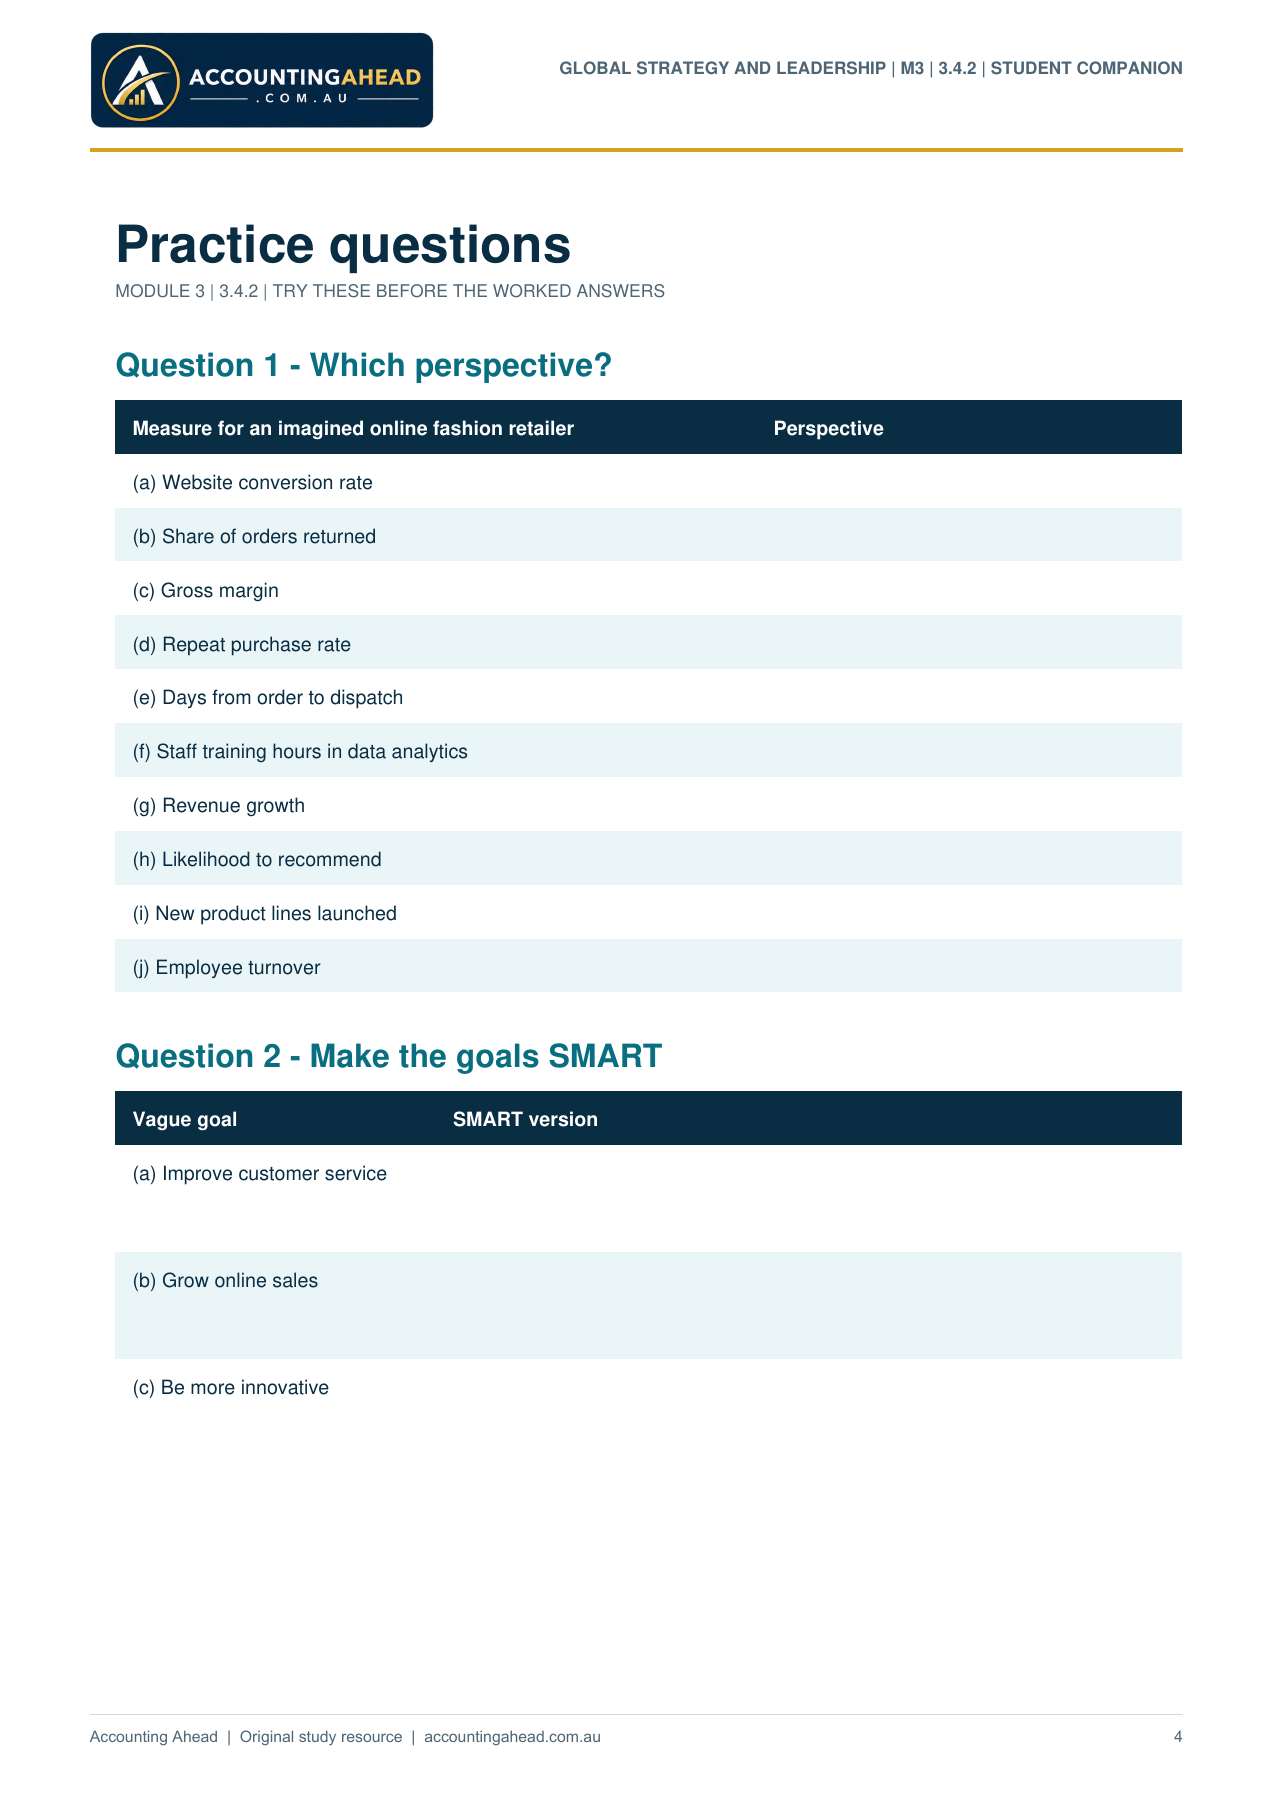
Practice questions
MODULE 3 | 3.4.2 | TRY THESE BEFORE THE WORKED ANSWERS
Question 1 - Which perspective?
Measure for an imagined online fashion retailer Perspective
(a) Website conversion rate
(b) Share of orders returned
(c) Gross margin
(d) Repeat purchase rate
(e) Days from order to dispatch
(f) Staff training hours in data analytics
(g) Revenue growth
(h) Likelihood to recommend
(i) New product lines launched
(j) Employee turnover
Question 2 - Make the goals SMART
Vague goal SMART version
(a) Improve customer service
(b) Grow online sales
(c) Be more innovative
GLOBAL STRATEGY AND LEADERSHIP | M3 | 3.4.2 | STUDENT COMPANION
4
Accounting Ahead | Original study resource | accountingahead.com.au
Question 3 - A scorecard for a charity
Imagine SecondServe, a charity that collects surplus food from supermarkets and delivers it to community
kitchens. Suggest one objective and one or two measures for each of the four perspectives, explain how you
would adapt the scorecard for a charity, and identify which measures are leading and which are lagging.
GLOBAL STRATEGY AND LEADERSHIP | M3 | 3.4.2 | STUDENT COMPANION
5
Accounting Ahead | Original study resource | accountingahead.com.au
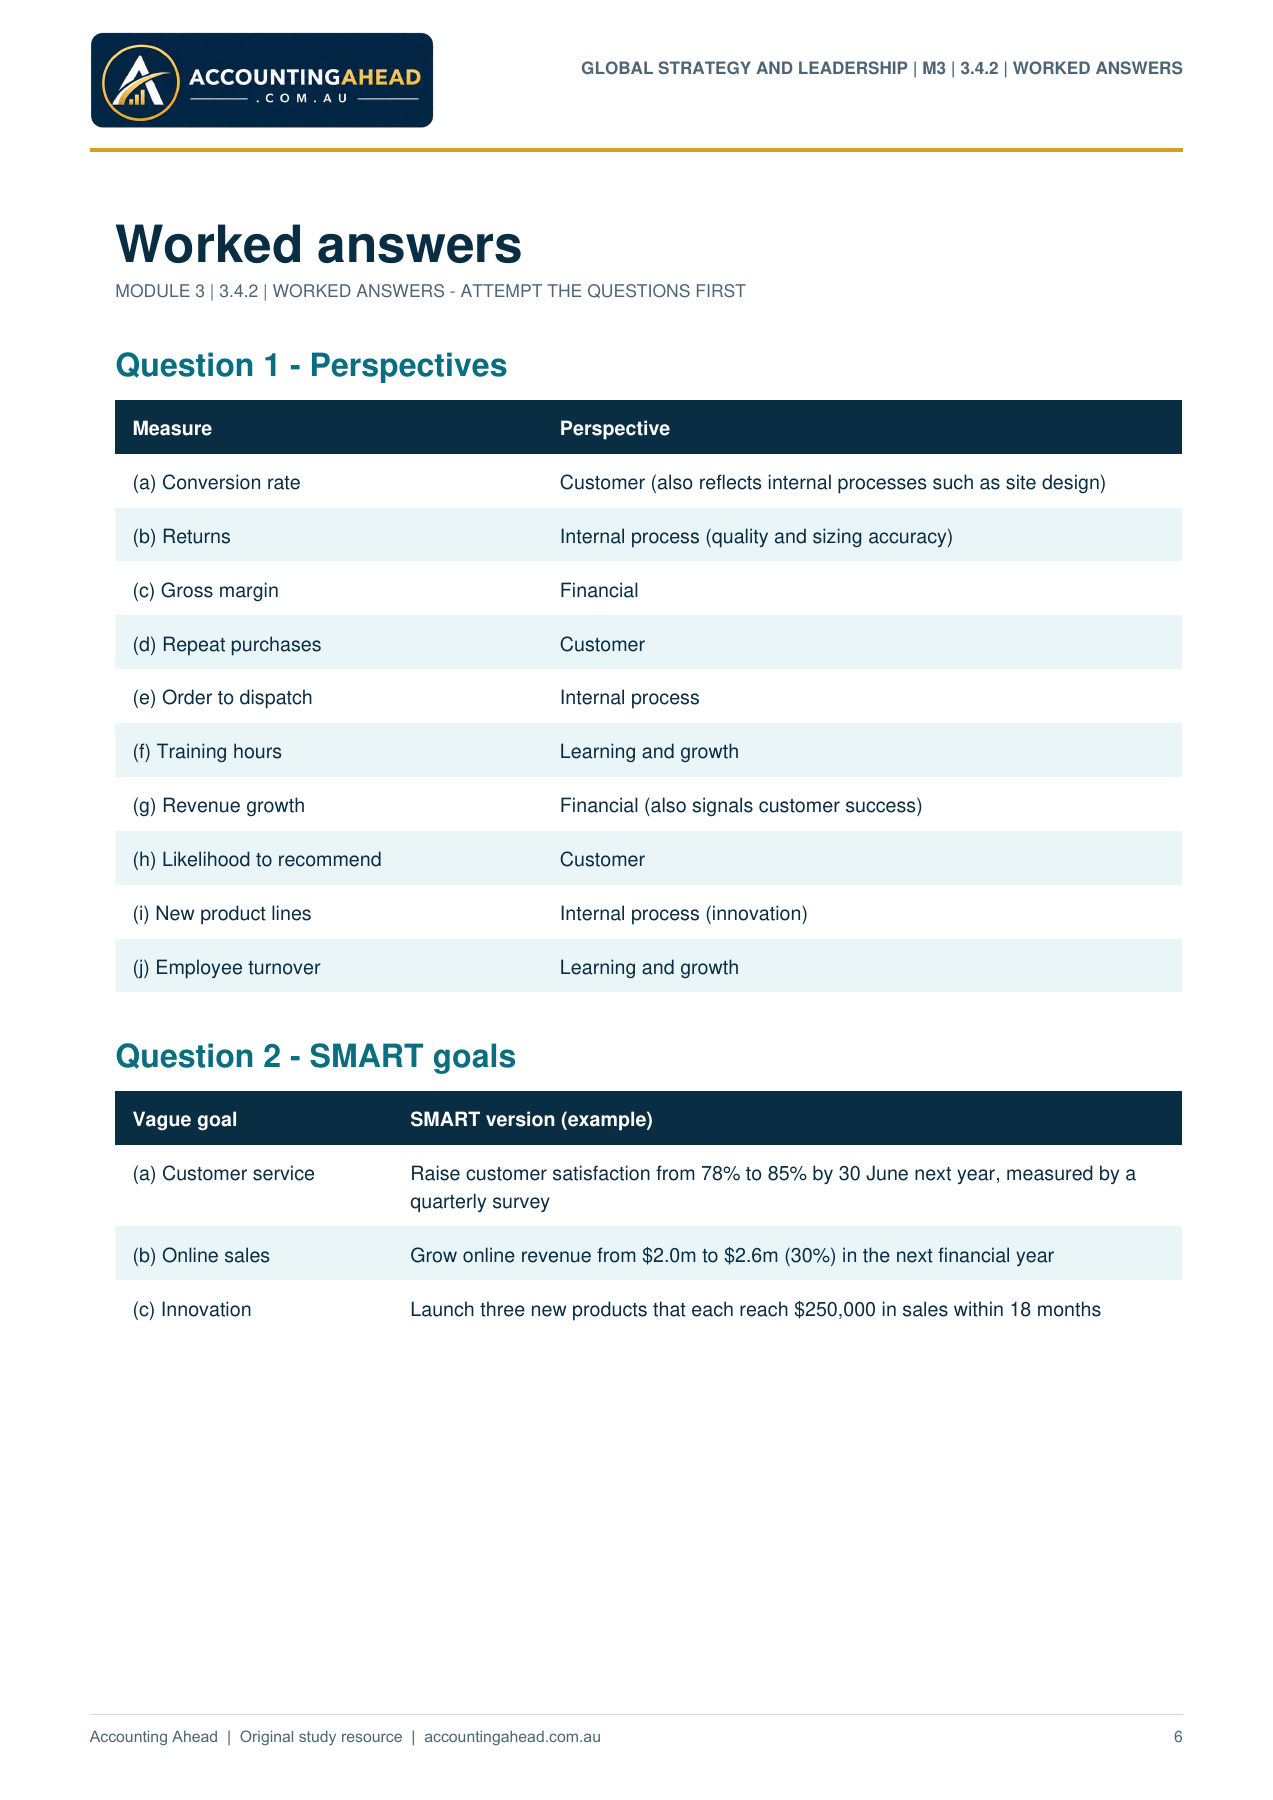
Worked answers
MODULE 3 | 3.4.2 | WORKED ANSWERS - ATTEMPT THE QUESTIONS FIRST
Question 1 - Perspectives
Measure Perspective
(a) Conversion rate Customer (also reflects internal processes such as site design)
(b) Returns Internal process (quality and sizing accuracy)
(c) Gross margin Financial
(d) Repeat purchases Customer
(e) Order to dispatch Internal process
(f) Training hours Learning and growth
(g) Revenue growth Financial (also signals customer success)
(h) Likelihood to recommend Customer
(i) New product lines Internal process (innovation)
(j) Employee turnover Learning and growth
Question 2 - SMART goals
Vague goal SMART version (example)
(a) Customer service Raise customer satisfaction from 78% to 85% by 30 June next year, measured by a
quarterly survey
(b) Online sales Grow online revenue from $2.0m to $2.6m (30%) in the next financial year
(c) Innovation Launch three new products that each reach $250,000 in sales within 18 months
GLOBAL STRATEGY AND LEADERSHIP | M3 | 3.4.2 | WORKED ANSWERS
6
Accounting Ahead | Original study resource | accountingahead.com.au
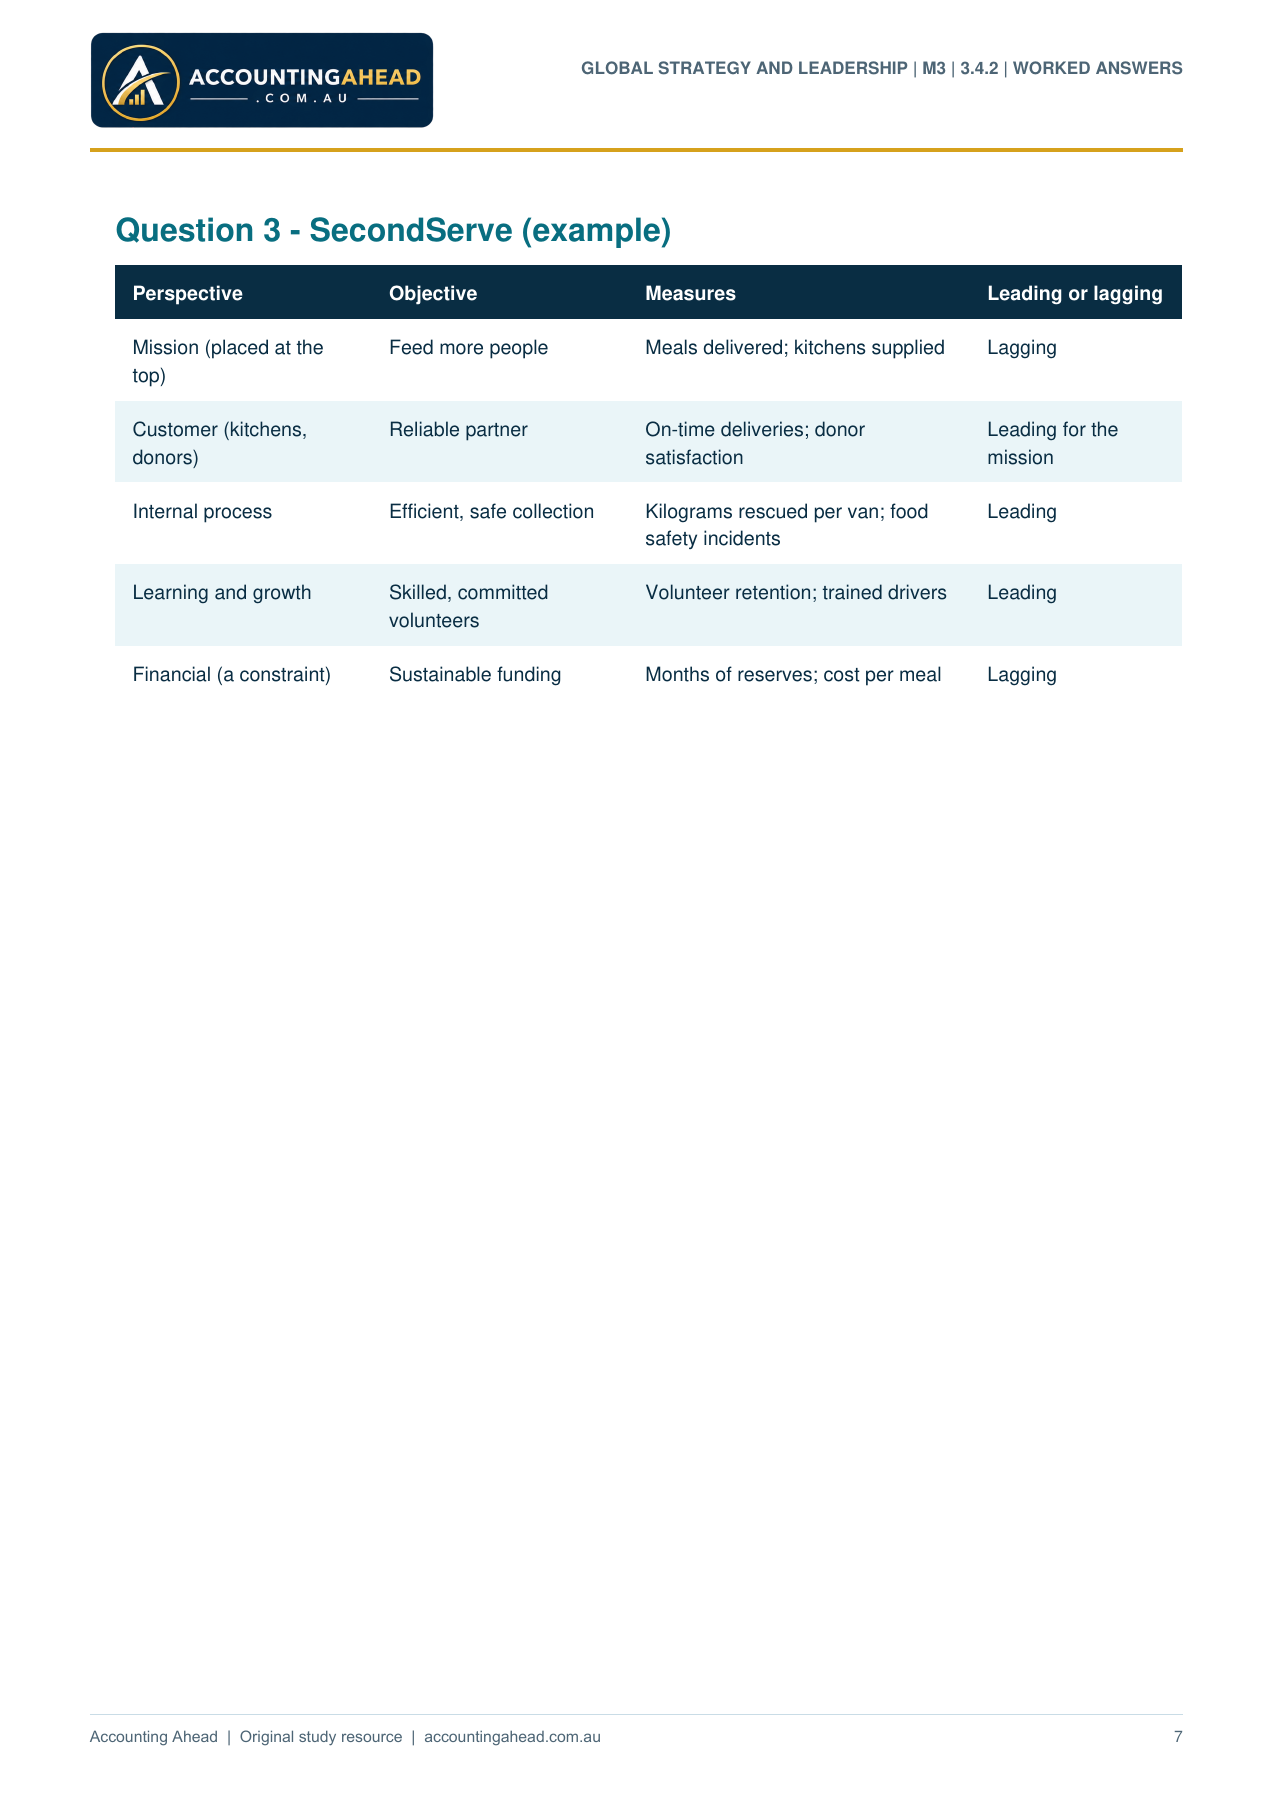
Question 3 - SecondServe (example)
Perspective Objective Measures Leading or lagging
Mission (placed at the
top)
Feed more people Meals delivered; kitchens supplied Lagging
Customer (kitchens,
donors)
Reliable partner On-time deliveries; donor
satisfaction
Leading for the
mission
Internal process Efficient, safe collection Kilograms rescued per van; food
safety incidents
Leading
Learning and growth Skilled, committed
volunteers
Volunteer retention; trained drivers Leading
Financial (a constraint) Sustainable funding Months of reserves; cost per meal Lagging
GLOBAL STRATEGY AND LEADERSHIP | M3 | 3.4.2 | WORKED ANSWERS
7