A schedule is a model of how work can be completed, not a list of desired finishing dates. Begin with the required deliverables and divide the work into manageable packages. A work breakdown structure, or WBS, organises the scope hierarchically. The activity list then identifies the tasks needed to produce that scope. Check that work is included once, responsibilities are clear and completion can be demonstrated.
The fictional Cedar Learning Hub is introducing a room-booking service. Its deliverables include an agreed booking specification, a working application, prepared facilities, trained hosts and an accepted service. The schedule must include testing and acceptance, not just installation. A milestone such as “service accepted” marks an event; the work required to achieve it has its own duration.
Dependencies explain why an activity must wait. Separate genuine technical requirements from preferred working arrangements. Assuming that one person can perform two concurrent full-time tasks can make an otherwise correct network impossible to deliver. Confirm resource availability and calendars before approving the dates.
PERT uses three activity-duration estimates: optimistic a, most likely m, and pessimistic b. The conventional weighted estimate is t = (a + 4m + b) ÷ 6. Its associated variance approximation is ((b − a) ÷ 6)². These are modelling assumptions, not guarantees about when a task will finish.
For Cedar's application configuration, suppose a = 4, m = 5 and b = 12 working days. The expected duration is (4 + 20 + 12) ÷ 6 = 6 days. The variance approximation is (8 ÷ 6)² = 1.78 days², and the standard deviation is about 1.33 days. The expected duration differs from the most likely estimate because the possible delay is asymmetric.
Avoid attaching an unsupported completion probability to these figures. Duration estimates can be correlated, and a different path may become critical. Adding expected durations along the currently longest path does not fully describe project completion uncertainty. Use consistent time units and explain whether figures represent working days, elapsed days or staff effort.
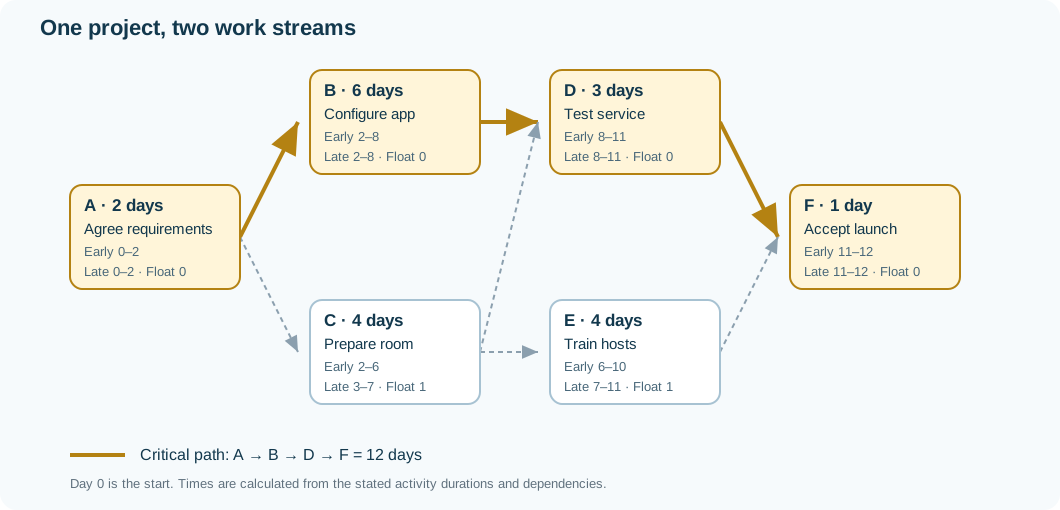
The following original activity-on-node example assumes finish-to-start dependencies, no time lags, sufficient separate resources for parallel activities and a common working-day calendar. Time starts at day 0. Arrows represent dependencies; their length does not represent time.
ID
Cedar activity
Immediate predecessors
Duration, days
A
Agree access and booking requirements
None
2
B
Configure the booking application
A
6
C
Prepare the room and network
A
4
D
Test the integrated service
B and C
3
E
Train reception hosts using the prepared room
C
4
F
Complete launch acceptance
D and E
1
Cedar Learning Hub: dependencies and critical path Scroll sideways on small screens, or open the diagram for a larger view.
In the forward pass, an activity's earliest start, ES, is the latest earliest-finish time among its predecessors. Its earliest finish, EF, equals ES plus duration. At a merge, all required predecessors must be ready: use the maximum, not the sum or average.
A runs from 0 to 2. B then runs from 2 to 8, while C runs from 2 to 6. D waits for both, so it starts at max(8, 6) = 8 and finishes at 11. E runs from 6 to 10. F starts at max(11, 10) = 11 and finishes at 12. Adding all six durations would incorrectly give 20 days because it ignores parallel work.
Work backwards to find float and the critical path
Set the final activity's latest finish, LF, to the required project completion time of day 12. An activity's latest start, LS, equals LF minus its duration. Moving backwards, its LF is the earliest LS among its successors: use the minimum, because it must be ready for every successor that needs it.
ID
ES
EF
LS
LF
Total float, LS − ES
A
0
2
0
2
0
B
2
8
2
8
0
C
2
6
3
7
1
D
8
11
8
11
0
E
6
10
7
11
1
F
11
12
11
12
0
For C, the successors are D and E. Their latest starts are 8 and 7, so C must finish by min(8, 7) = 7 and start by day 3. Its total float is one day. C and E do not each provide a separate extra day that can be used without consequence: delaying C can consume the allowance available to E on the same route.
The longest route, A → B → D → F, is 2 + 6 + 3 + 1 = 12 days, and is the critical path. The other routes are A → C → D → F at 10 days and A → C → E → F at 11 days. Critical activities have zero total float in this unconstrained example. A delay on a critical activity delays completion unless another feasible change offsets it.
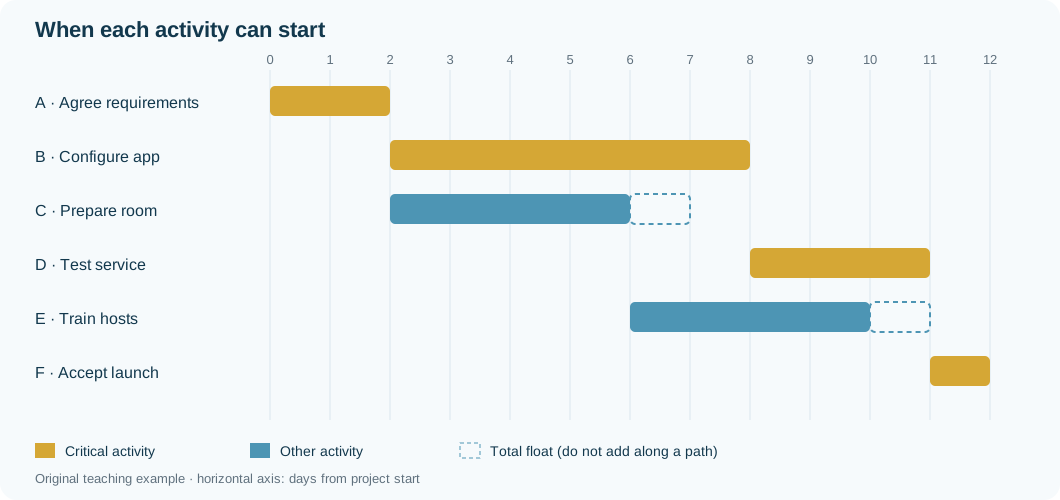
A Gantt chart displays activity bars against a time axis. Cedar's earliest-start bars would be A 0–2, B 2–8, C 2–6, D 8–11, E 6–10 and F 11–12. This makes overlap visible; dependency links explain it. Show the approved baseline separately from current forecasts and actual progress rather than continually moving the original bars.
Cedar Learning Hub: earliest-start schedule Scroll sideways on small screens, or open the diagram for a larger view.
At a reporting date, distinguish a completed task, a started task with work remaining, and a task that has not started. Update remaining durations and recalculate the network. A visually short bar is not necessarily unimportant: a one-day acceptance task can determine launch, while a longer task may have float. Software helps maintain this logic but cannot decide whether a missing predecessor or unrealistic resource assumption is acceptable.
Crashing reduces duration by spending more resources, where this is technically feasible. A simple incremental cost per day saved is (crash cost − normal cost) ÷ (normal duration − crash duration). Do not shorten required quality or safety work merely to claim an earlier finish. Recalculate after each change because new critical paths can emerge.
Cedar's normal direct activity cost totals $10,000. The following are the only available crash options; C and F cannot be shortened. Each listed option saves one day.
Activity
Normal duration
Minimum duration
Extra direct cost for the one-day reduction
A
2
1
$900
B
6
5
$400
D
3
2
$250
E
4
3
$350
Initially D is the cheapest critical activity to shorten. Reducing D to two days costs $250 and makes the project 11 days. There are now two critical routes: A–B–D–F and A–C–E–F, both 11 days. Reducing B alone would leave the second route at 11 days and would not bring launch forward.
To reach ten days, shorten both B and E for a further $750, or shorten shared activity A for $900. The combined B-and-E option is cheaper. Suppose Cedar also incurs $500 of avoidable support cost for every project day, with no other early-completion benefit:
Schedule
Direct cost
Time-related cost
Combined cost
12 days, normal
$10,000
$6,000
$16,000
11 days, shorten D
$10,250
$5,500
$15,750
10 days, shorten D, B and E
$11,000
$5,000
$16,000
9 days, also shorten A
$11,900
$4,500
$16,400
Under these assumptions, 11 days has the lowest combined cost. A contractual deadline or an additional benefit might justify ten days, but that changes the decision. Check marginal benefits against the additional cost of the next feasible reduction, rather than assuming that the fastest schedule is best.
Time-phase costs against the activities that consume resources. Cedar's direct costs might be A $800, B $3,000, C $1,500, D $2,000, E $1,800 and F $900: a total of $10,000. Allocate them to the schedule using a justified pattern. A supplier deposit, milestone payment or final invoice need not occur when the associated work is performed, so a cash forecast and a cost budget answer different questions.
An approved baseline provides the reference for control. A latest forecast estimates the likely outcome. Maintain both, with approved changes identifiable; revising the forecast should not erase the record of an overrun. Identify contingencies and who may release them. A favourable allocated-overhead variance may have little relevance to a manager who cannot influence that allocation.
Supplier terms change the monitoring emphasis:
Fixed price: focus on the agreed deliverables, acceptance, timing and variations. The supplier bears more cost-overrun exposure for the defined scope, but changes and disputed scope can still affect the buyer.
Time-based payment: verify authorised hours, rates, progress and remaining effort. More billable time is not necessarily more useful output.
Cost plus: examine eligible costs, supporting records and the agreed fee. Unsupported or excluded expenditure should not be treated as automatically reimbursable.
Payment incentives should support the desired result, including quality. These are commercial-control distinctions; the actual contract determines rights and obligations.
Question: After D has been shortened, Cedar's manager offers to shorten B by one day for $400 and promises a ten-day project. Is the promise supported?
Explained answer: No. A–C–E–F still takes 11 days. B's reduction alone gives no project-time saving. The ten-day plan requires another change affecting that route, such as shortening E as well, or a feasible reduction in shared A. Recalculate dependencies, total cost and quality implications before approval. A shorter individual activity is not the same as a shorter project.